6
and the moisture condenses – e.g. indoors on walls, outdoors it leads to the
formation of fog or precipitation.
Normal indoor air at 22°C and 40% humidity, which is generally found to be
comfortable, has – for example – a dew point of approx. 8°C. This information is
particularly helpful for preventing the formation of mould. As soon as the
temperature of e.g. external walls reaches the dew point or falls below it, moisture
will be deposited; in the long term this can lead to the formation of mould.
Remarks: The dew point temperature range of the hygrometer extends from 0°C
to 50°C. If the dew point temperature exceeds 50°C, “HH.H” appears on the
display; if it is below 0°C, “LL.L” appears on the display.
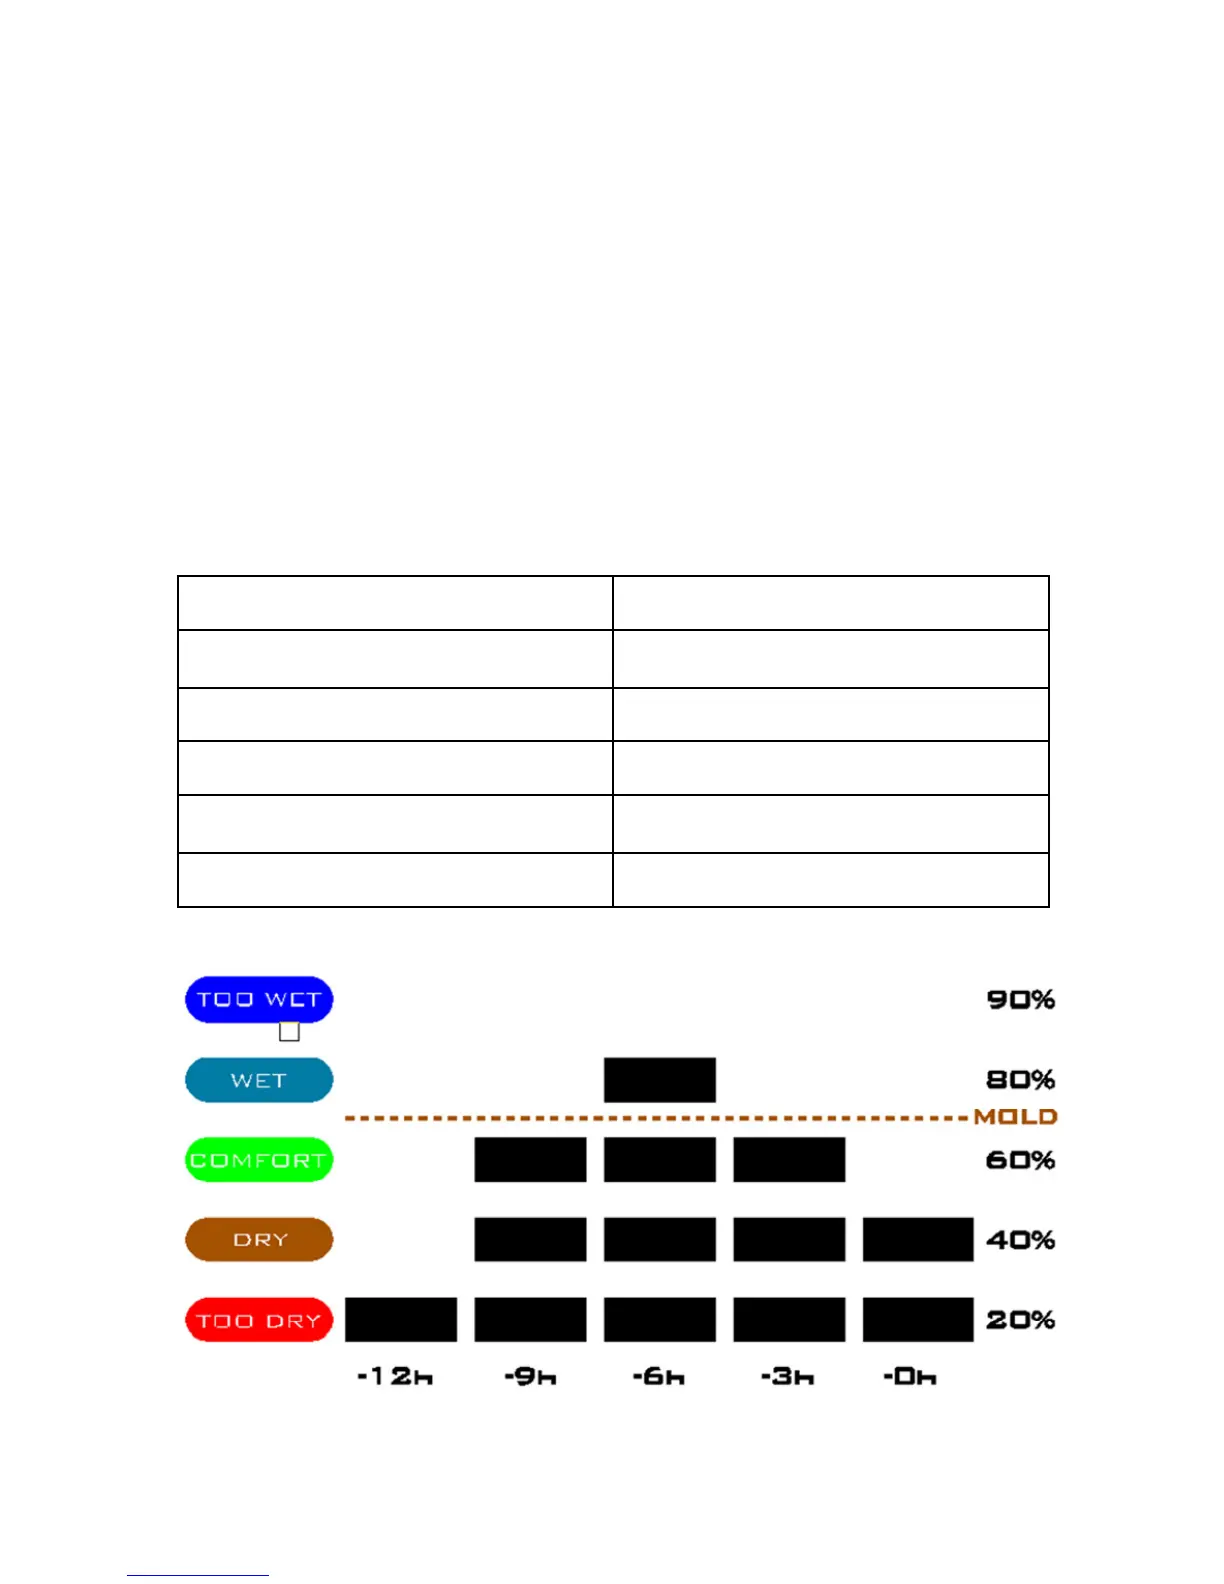
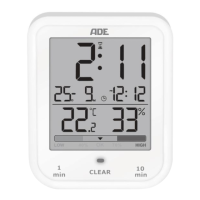
Graphical representation of humidity within the last 12 hours.
In the graphical representation, you can easily read the record of the relative
humidity and the perceived level in the room within the last 12 hours.
Perceived level (comfort index) Relative humidity
Too wet 81% to 90%
Wet 61% to 80%
Comfortable 41% to 60%
Dry 31% to 40%
Too dry 20% to 30%