Installation Completion and System Verification 3
Step 5. Verify the Triple Quadrupole LC/MS sensitivity
Agilent 6400 Series Triple Quad LC/MS System Installation Guide 67
h For sensitivity verification with a standard checkout on 6410/6430:
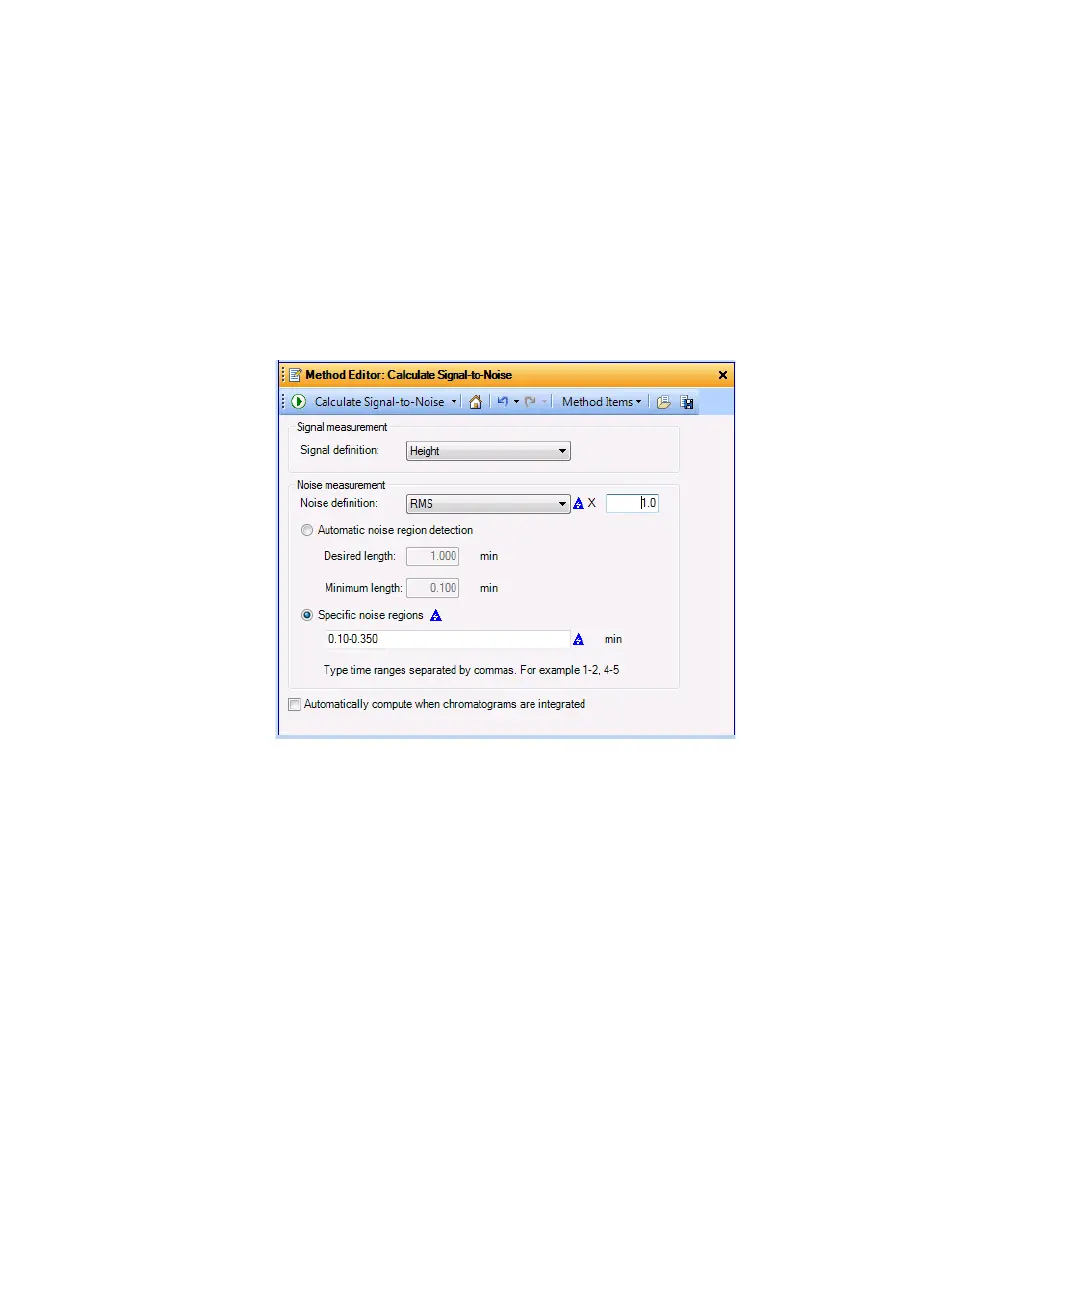
Under Noise Measurement, for Noise definition, select RMS and select
X1.
For Specific noise regions, type 0.100 - 0.350. Make sure that the
noise region does not include the chloramphenicol peak. (or reserpine
peak for Positive Ion Mode).
Figure 34 Calculate Signal-to-Noise dialog box (for standard checkout) on 6410/6430
models
3 Generate a printout of each signal-to-noise calculation report for each
solvent blank and sample injection. Include the chromatogram in the
printout.
4 Open the Excel spreadsheet D:\MassHunter\Support\Checkout\Sensitivity
Checkout Report.xlsx. Fill in the values to calculate the average signal to noise
and save the spreadsheet.
The average signal-to-noise must be greater than that listed in these tables,
depending on the checkout type:
• Standard installation – Table 5 on page 70
• Marketing Bid Specification – Table 6 on page 70
• IDL Marketing Bid Specification – Table 7 on page 71
5 Generate a printout of the Excel signal-to-noise report.

 Loading...