Specifications 97
Stopplng dlstances
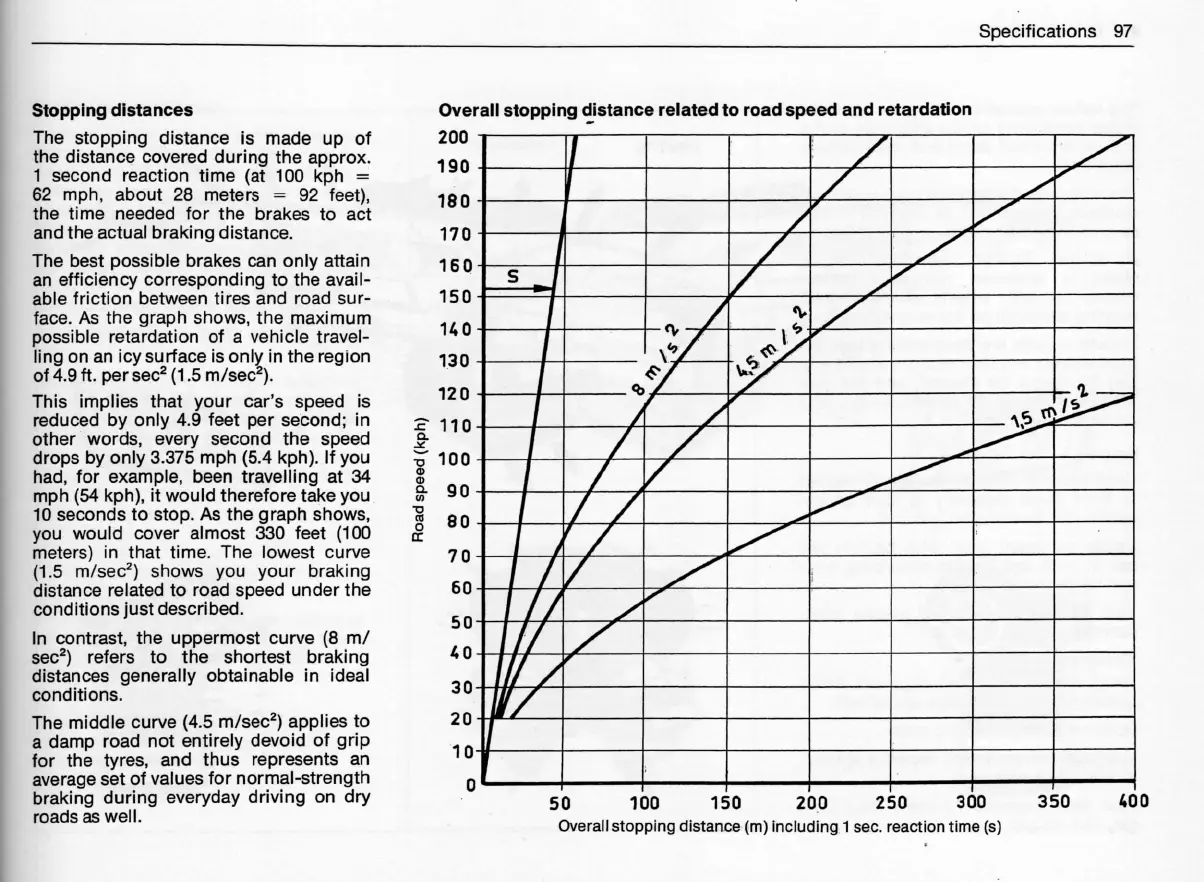
The stopping distance is made up of
the distance covered during the approx.
1 second reaction time (at 100 kph =
62 mph, about 28 meters = 92 feet),
the time needed for the brakes to act
and the actual braking distance.
The best possible brakes can only attain
an efficiency corresponding to the avail-
able friction between tires and road sur-
face. As the graph shows, the maximum
possible retardation of a vehicle travel-
#8.8#.a#gescu2ii.C5e+S/8en:¥)i.ntheregion
This implies that your car's speed is
reduced by only 4.9 feet per second; in
other words, every second the speed
drops by only 3.375 mph (5.4 kph). lf you
had, for example, been travelling at 34
mph (54 kph), it would therefore take you
10 seconds to stop. As the graph shows,
you would cover almost 330 feet (100
H:ier:),si:c2t,hastht:#e.,Tohue)::,esàrà##:
distance related to road speed under the
conditionsjustdescribed.
ln contrast, the uppermost curve (8 m/
sec2) refers to the shortest braking
distances generally obtainable in ideal
conditions.
The middle curve (4.5 m/sec2) appli® to
a damp road not entirely devoid of grip
for the tyres, and thus represents an
average set of values for normal-strength
braking during everyday driving on dry
roads as wel 1.
Overall stopping distance related to road speed and retardation
200
190
1òo
170
160
150
140
130
120
110
/
/
/
/
/
S
/
Ow3`b
/
/
0,\2Q
/
q,
/sO
/
\,6
/
/ /
/ /
/
//
/
/
'
//
1
//
'//
.,
///
r// ZI
/
50 100 150 200 250 300 350 400
0verall stopping distance (m) including,1 sec. reaction time (s)