A simple measure of the statistical RMS fluctuation for random signals (the possible
range of error in the averaged RMS signal) is given by:
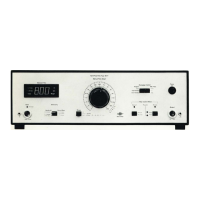
Centre Frequency
Tn (s) (Hz) 2
3,15
10
31,5 100 315
1 k
3,15k
10k
0,1
1,5
0,9
0,5 0,3
0,3
1,5 0,9 0,5
0,3
1
1,5
0,9 0,5
0,3
3
,5
0,9
0,5 0,3
10
1,7
0,9
0,5
0,3
6 ci<c‘
30
1,2 0,9 0,5 0,3
Fk2.
SV344
100
0,7 0,5
0,3
770411
1
e - (5 12)
2VBTA
where e is the fluctuation
B is the measuring bandwidth, or signal frequency bandwidth (whichever is the
smaller) in Hertz
TA is the averaging time, or signal duration (whichever is the smaller) in se-
conds.
This expression is an approximate relationship, but carries sufficient accuracy for BT pro-
ducts greater than 5. It expresses the limits of the signal variation to a confidence level
of approximately 68%, i.e. there is a 68% probability that the result will be within ± c of
the true value.
5.3. PRACTICAL ANALYSIS OF STATIONARY SIGNALS
The following parameters must be considered:
1. Averaging Time
2. DC or AC recording
3. Recorder Writing Speed
4. Recorder Paper Speed
5.3.1. Averaging Time
Use equation (5.12) to obtain a suitable averaging time for random signals, depending
upon the desired accuracy. Table 5.1 gives a range of standard deviations (in dB) for a
series of averaging times and frequencies. Normally the lowest frequency in the analysis
governs the averaging time selected. However, for each half decade that frequency is in-
creased, the averaging time can be reduced by a factor of ITO (normal steps on B & K
Measuring Amplifiers).
As the bandwidth of octave-band filters is three times greater than that of third octaves,
averaging times for them should be reduced by a factor of 3 from the values given in
Tab l e 5.1.
Tab le 5.1. Standard error (e) in dB for third-octave filters in combina-
tion with various averaging times
26
 Loading...