At
the high frequency
end
of
the spectrum the peak value
of
the signal
measured on the
filter
output
will
often
be
very
large
compared
with
the
RMS value. High demands
are
therefore made
of
the RMS detector
for
accuracy
within
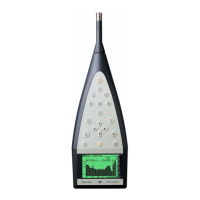
this region. The RMS detector in the 2209
will
deal
with
crest factors
as
high
as
40, (10 at
full
scale)
which
is
sufficient
for
most
applications.
Furthermore, overload lamps
will
inform
the operator
if
the measuring
conditions
lie outside the specified
range.
7.4. LOUDNESS
EVALUATION
IN ACCORDANCE WITH
ISO
R 532
7 .4.
1.
1/3 Octave
The loudness
of
sounds
can
be
evaluated
from
1/3
octave analyses
of
smooth broadband
or
even
distinct line spectra. The procedure,
suggested
by
E.
Zwicker,
is
one
of
the
two
methods described in ISO recommendation 532.
The 1
/3
Octave spectrum I
eve
Is
of
Fig.
7.
15 may
be
transformed onto the
"Zwicker
Diagram"
of
Fig.7.16. Note
that
Fig.7.16
is
only
one
of
a number
of
measurement conditions described in
ISO
R 532. For the
full
procedure
in
calculations
of
loudness, refer
to
the
ISO
document.
The
level
of
loudness in phones (GF
or
GD)
is
calculated
from
the total
area
and
is
read
from
a
scale.
BrUet
&
Kjzr
BrUel
&
Kjzr
BrUel
&
Kjzr
DDDDDDDDDDDODDDDDDDDDDDDDDDDDDD
DDDDDDDDDDDDDDOODDDD
Br~~~!jnatr
50
Po
tent
iometer Range:
_dB
Rectifier:
__
Lower Lim Freq
___
Hz
Wr
Speed _
mm
/
sec
. Paper Speed.-
mm
/
sec
Measuri
ngObject
:
40
Electric Shaver
---
30
---
20
R
ec.
No
.:
464
-
Date
:
~10
Sign.
:
....s...L.i!L__
~~
:
Const
.:
35
.
msec
.
We
i~t.
Netw
.:_
Ref. Level :
__
o
OP 1152
6~~~e~~~:::;:
12.s
16
20 25
ll
.S40
80
~
f-
1=1=-
-
I=
I
-1-
-
1--
1--f--
1--
1-'1--
22.5
4
3.
15
:-
;-
·!=
1--
t-
-;-
,__;-
1- 1-
1--l--'-
·
.__,___
=i=i=i::!=
1--1--1-- 1--1--
I+
1-'--1-
t~
H -
1--1--
1-t
...
id-!=t=
~
~--
~--~--
~
-
~~--sr:§§
f--
1-
-f-
1--1--1-1--
I I ·
r=:=
6.3
10
8
20
16
12
.5
40
l1n
31
.5
We1ght
25
,
,,,~
1113 0 A 8 C
L1n
.l
1?'.2089
Fig.7.15.
1/3
Octave spectrum
of
the noise
from
an electric shaver
101
 Loading...