36
00001w~wwuuuuuuuuuuuuuuuuuuuuuuuu
,
uuu~~~~~~~~~DOODDO
Briiel & Kjaer Briiel & Kiaer
100%
~
25%
80
20
60
15
40
10
20
~,
L10
5
:
147 dB
0
0
OP
0102
100
110
120
130 140
150 160
170
dB
810427
0,
1-0,3--1
--3--10-30-100-3ooms
-
2
WB
HA
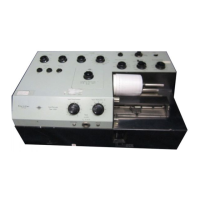
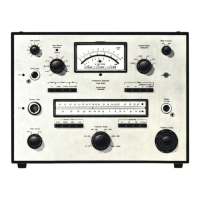
Fig.
4.6.
Lining up the Scale SC 2363 over a cumulative
plot
of
Hand-Arm
vibration measurements
The Scale should
be
laid over the curve so that the calibration line, recorded when calibrating
the level recorder paper, corresponds to the vertical line labelled WB (for measurements in the
WHOLE BODY mode, Figs
4.5
and
4.6),
or HA (for measurements in the HAND - ARM mode,
Figs
4.
7 and
4.8).
If the calibration procedure has been carried out as described above, then
this line will correspond to the bottom of the measurement range of the
2512,
and each tick on
the horizontal axis of the scale at 4 mm intervals corresponds to 2 dB.
DODOO
-
--
..
- - -
~LIULILILILILILIUWLILILIULILJ~LILIULIULILJLILILILI~~~~~~~~~~ooooo
Briiel
& Kjaer
Briiel & Kjaer
100%
25%
Full Scale
80
20
Deflection
50%
60
15
40
10
20
5
.
0
0
OP
0102
100 110 120
130
140 150
160
170dB
810429
· u,
1--0,3--1
--3--
10-30-100-3ooms
-
2
WB
HA
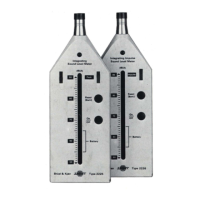
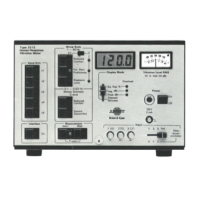
Fig.
4.
7.
Lining up the Scale SC 2363 over a statistical distribution
plot
of
Whole Body vibration measurements
OO
OO
w~uuuuuuuuuuuuuuuuuuuuuuuuuuuuuuuuuuuwu
000000
100%
Briiel
& Kjaer
Briiel
&
Kia,r
25%
Full Scale
80
-
Deflection
20
t----
50%
60
15
40
10
20
5
0
0
OP
0102
100 110 120 130 140
150
160
170 dB
810436
0,
1-0
,
3--1
--3--
10--30
--
100-
300ms
- 2
W8
HA
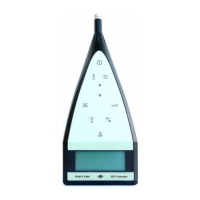
Fig.
4.8.
Lining up the Scale SC 2363 over a statistical distribution
plot
of
Hand-Arm vibration measurements
For cumulative distributions, the vertical axis of the paper is
calibrat~d from
Oto
100
% using
the
left hand scale, and the
LN
value can be found by entering the vertical axis at the required
LN,
e.g. L
1
o in the examples in Figs.4.5 and
4.6.,
and reading off the dB value on the horizontal
axis.
For statistical distributions, the full scale level is defined during the calibration of the level
recorder prior to readout. The method of calibration is described in detail in the 4426
Instruction Manual.
In
the case of the examples
in
Figs.4.7 and
4.8,
full scale represents
50
%.
 Loading...