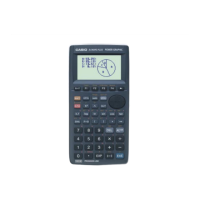
A Resource for Free-standing Mathematics Qualifications Using the Casio fx-7400G PLUS
The Nuffield Foundation 2
TO FIND OUT HOW WELL A MODEL FITS DATA
Use MENU 4 (GRAPH) and the notes overleaf, using when necessary to find
the options you need.
• Use the PARM option to enter the points first.
• Then use the Y= option to enter the function.
• Press DRAW (F4) to plot the points and then the function.
TO FIND A FUNCTION TO MODEL DATA
Use MENU 2 (STAT)
• Enter the data values, pressing EXE after each value. There are 6 lists.
Press on the REPLAY button if you want to use lists 3, 4, 5 or 6.
• To delete previous values, press then DEL A (F2) to delete a whole list
and DEL (F1) to delete just the highlighted value.
• To choose which lists the graph will use, press GRPH (F1) then
then SET (F4). The display will show the set-up for Graph 1.
Use on the REPLAY button to scroll down.
Check that the G-Type is Scat (if it isn’t, press F1).
Use the F buttons to choose lists for the X and Y values on the graph.
The Freq should be set to 1.
M-type gives you a choice of different markers for the points.
If you want to select lists for another graph, highlight StatGraph1 at the top of the
list, then use the F buttons to select another graph.
Finally press EXE or QUIT to return to the lists.
• To draw a graph of the points press GPH1 (F1) or one of the other F buttons.
• To find a model
Press X (F1) for a linear function or X^2 (F3) for a quadratic function.
Press then one of the F buttons for other options.
eg Exp (F2) gives the best exponential function to model the data.
Note that the given r value is a measure of how closely the function fits the data.
A value of 1 or – 1 means the function is an exact fit.
Press DRAW (f4) to draw the graph of the function over the points.
Press QUIT to go back to the lists.

 Loading...