EasyManuals Logo

Casio fx-9860GII Quick Reference Guide

Casio fx-9860GII
20 pages
To Next Page IconTo Next Page
To Previous Page IconTo Previous Page
Page #11 background imageLoading...
Page #11 background image
Getting Started with the fx-9860GII
STATISTICS
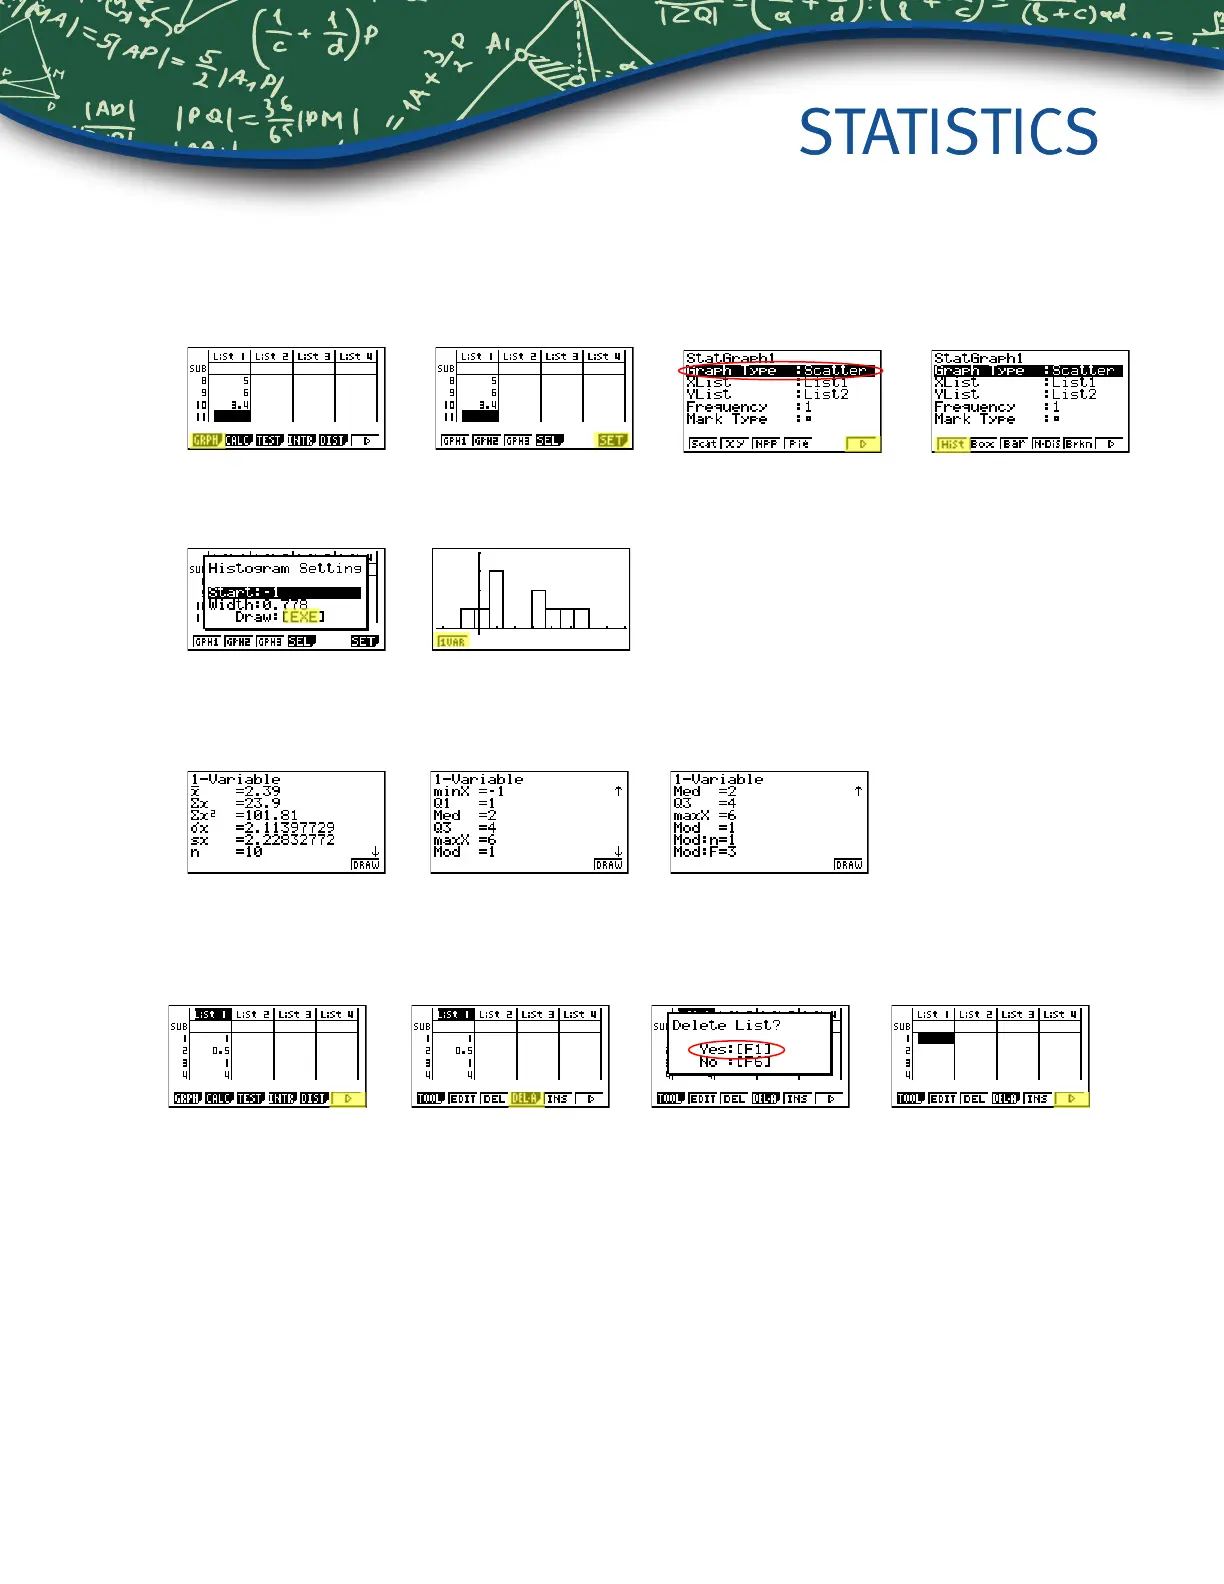
3. The initial default graph is a scatter-plot. To change the type of graph you would like to use,
press q (GRPH), then u (SET), arrow down to Graph Type, for this set of data, we will make
a histogram, press u, and then q for histogram.
4. Press d to return to your list of data, select q (GPH1) then l to see your graph.
5. The following screen shots show one-variable calculations that can be obtained by
pressing q.
6. To delete this set of data, press d until you return to the initial List Editor screen. Select u
for more options, arrow up until List 1 is highlighted, select r (Del-A), then q.
STATISTICS
11

Other manuals for Casio fx-9860GII

Questions and Answers:

Question and Answer IconNeed help?

Do you have a question about the Casio fx-9860GII and is the answer not in the manual?

Casio fx-9860GII Specifications

General IconGeneral
TypeGraphing
Form factorDesktop
Control typeButtons
Product colorSilver
Housing materialPlastic
Built-in capabilityYes
Digits- digits
Display typeLCD
Second displayNo
Display tilting-
Display resolution64 x 128 pixels
Display character size8 x 21 mm
Display number of lines8 lines
Display number of characters21
Flash memory1.5 MB
RAM capacity0.064 MB
Storage media typeFlash
Battery typeAAA
Power sourceBattery
Number of batteries supported4

Related product manuals