125 Hertz
250 Hertz
500 Hertz
1000 Hertz
2000 Hertz
4000 Hertz
8000 Hertz
16000 Hertz
Power Handling
There are many different approaches to
power handling ratings. Crest rates this
loudspeaker system’s power handling
using a full-range form of the AES
Standard 2-1984. Using audio band 20 Hz
to 20 kHz pink noise with peaks of four
times the RMS level, this strenuous test
signal assures the user that every portion
of this system can withstand high inpact
music. This rating is contingent upon hav-
ing a minimum of 3 dB of amplifier head-
room available.
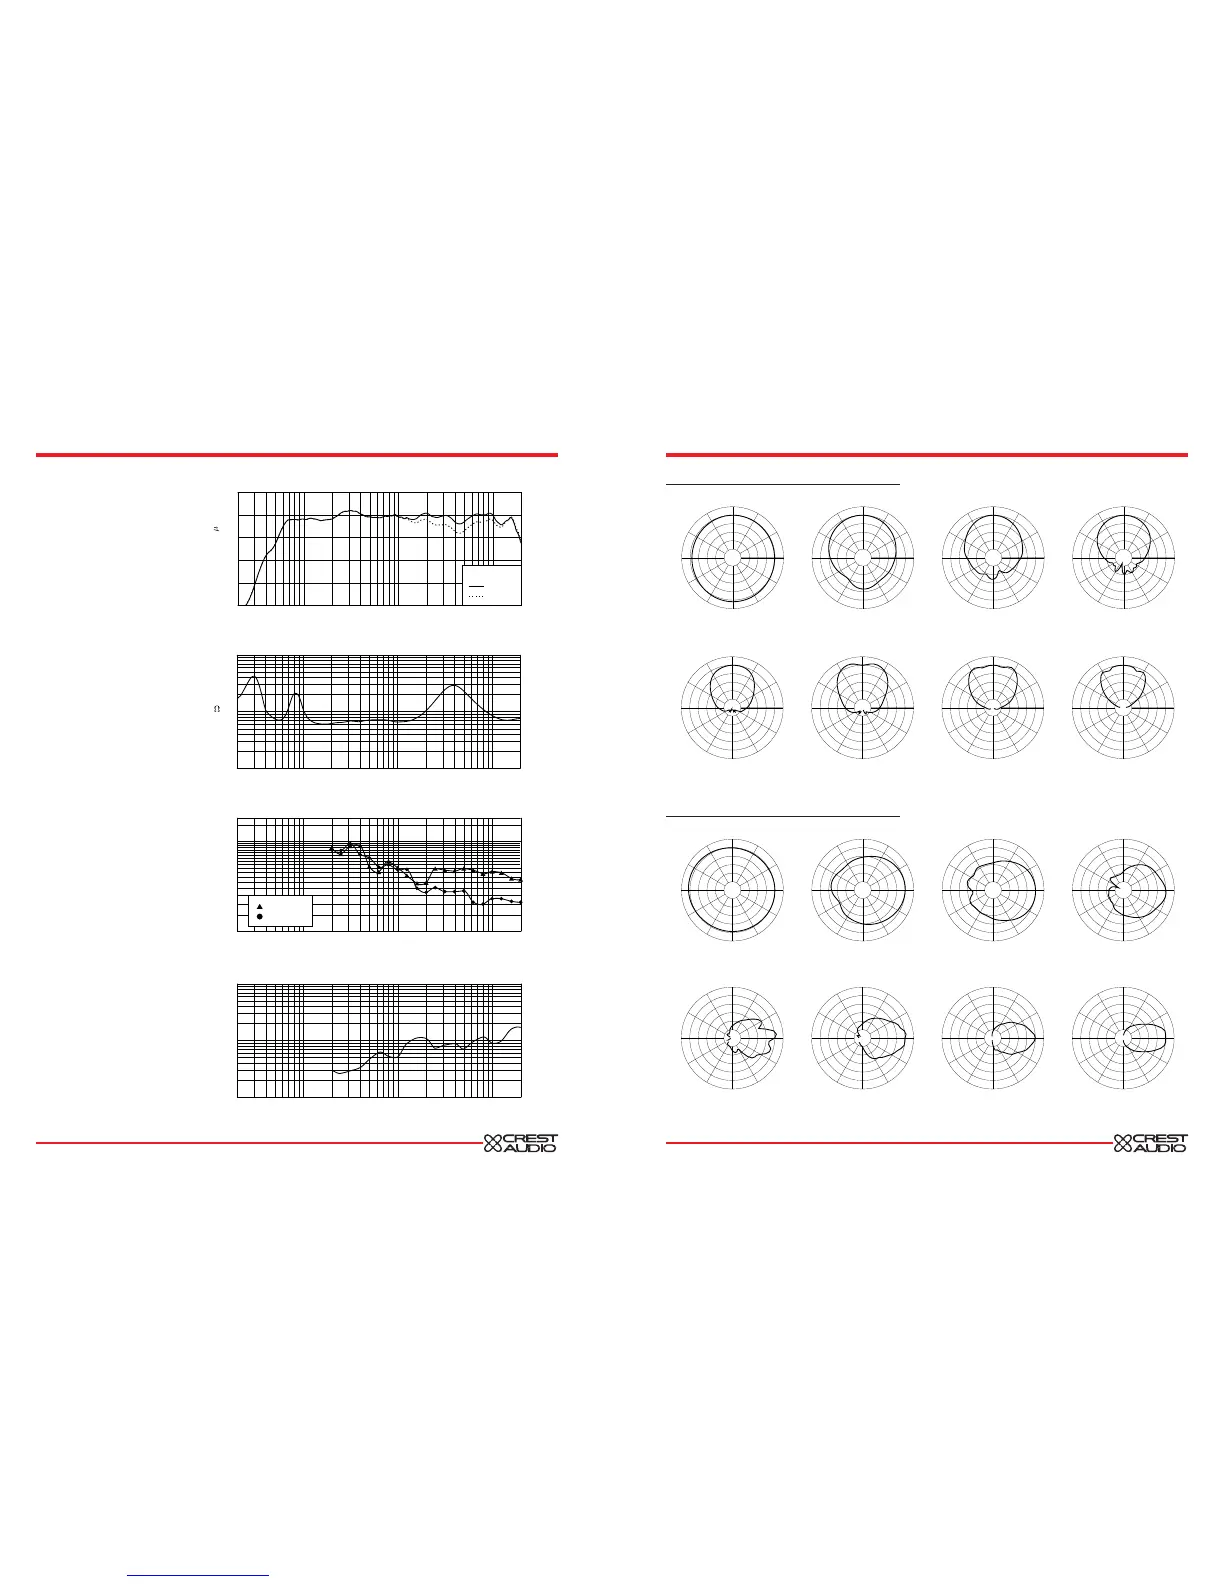
Frequency Response
This measurement is useful in determin-
ing how accurately a given unit repro-
duces an input signal. The frequency
response of the Crest LQ 15 is measured
at a distance of 1-meter using a 1 Watt
(into the nominal impedance) swept-sine
input signal. As shown in figure 1, the
selected drivers in the Crest LQ 15 com-
bine to give a smooth frequency response
from 64 Hz to 18 kHz.
Directivity
Beamwidth is derived from the -6 dB
points from the polar plots (see figure 3)
which are measured in a whole space
anechoic environment. Q and Directivity
Index are plotted for the on-axis measure-
ment position. These are specifications
that provide a reference to the coverage
characteristics of the unit. These parame-
ters provide insight for proper placement
and installation in the chosen environ-
ment. The blending of the components of
the Crest LQ 15 exhibit a desirable
beamwidth and directivity (figure 3 and 4)
suitable for sound reinforcement applica-
tions.


 To Previous Page
 Loading...
