Viewing Statistics and Remote Monitoring 495
Charts
The Chart menu page contains links to web pages that allow you to chart statistics on a graph. To display
the Charts menu page, click Statistics/RMON
→
Charts in the tree view. The Charts menu page
contains links to the following features:
•Ports Statistics
•LAG Statistics
Ports Statistics
Use the Ports Statistics
page to chart port-related statistics on a graph.
To display the page, click Statistics/RMON
→
Charts
→
Ports in the tree view.
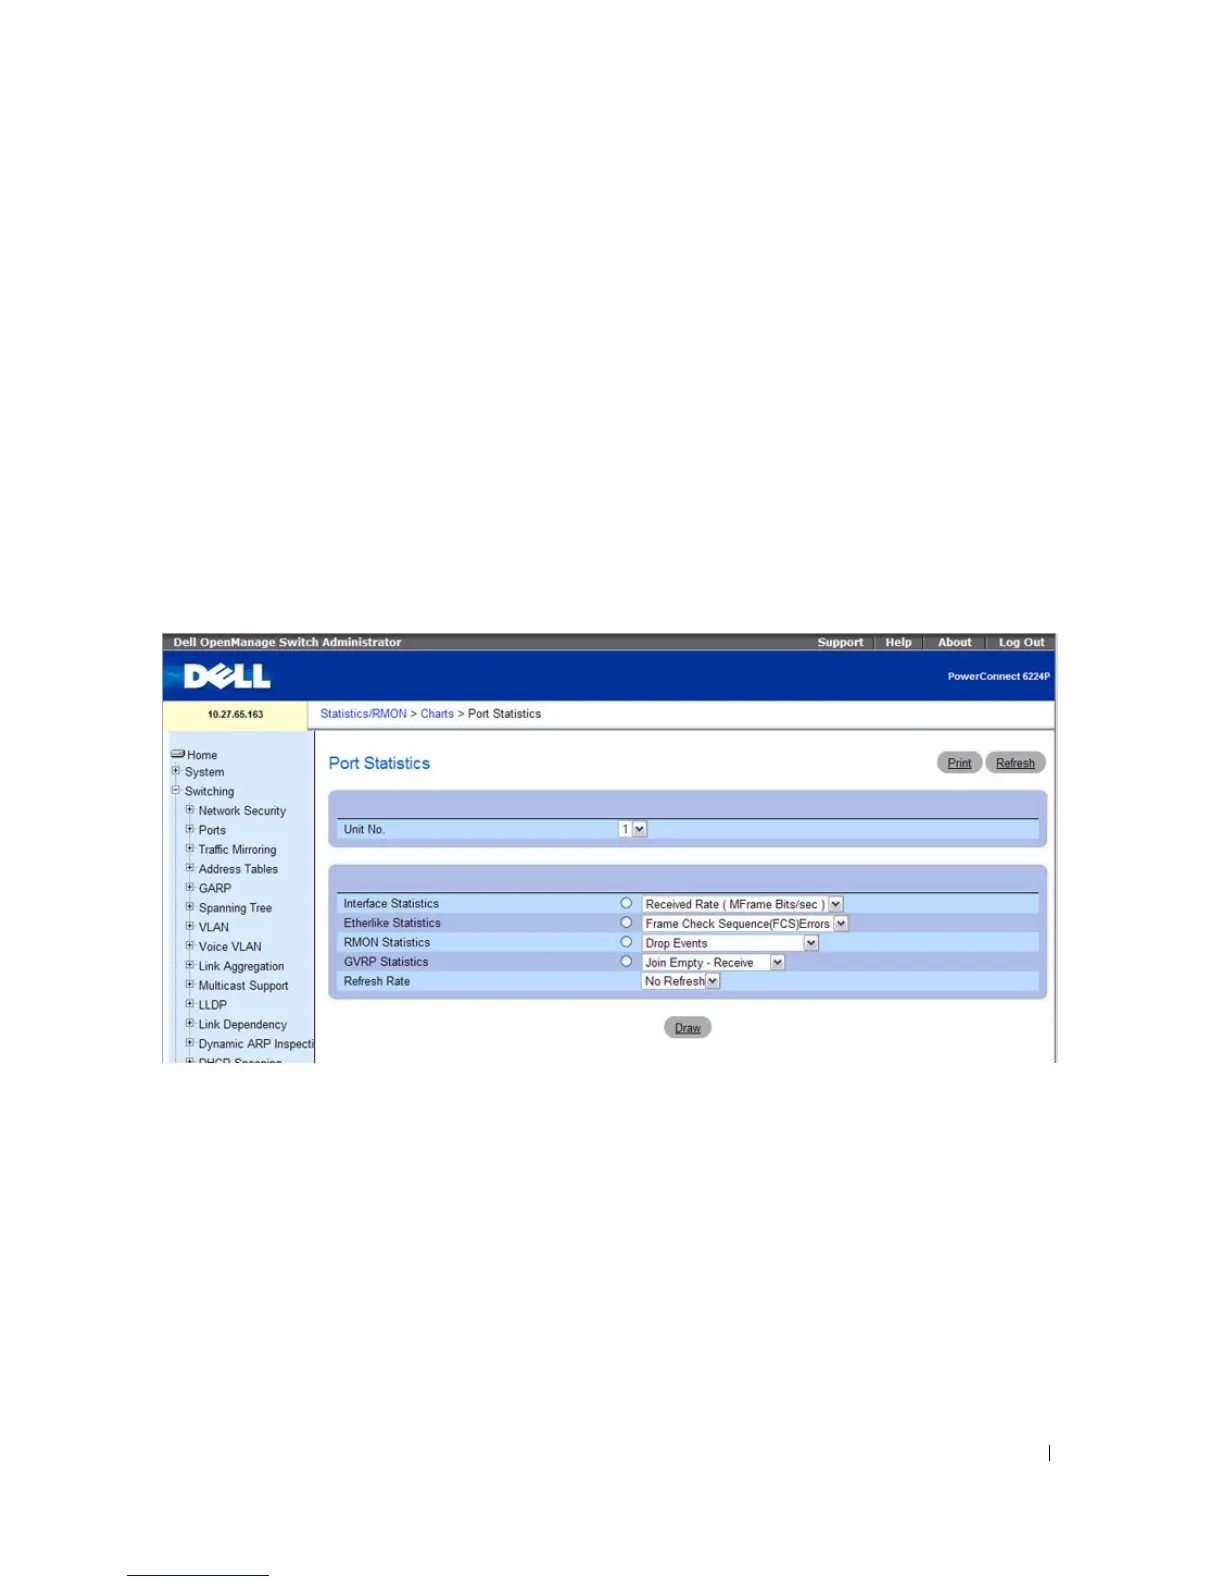
Figure 8-19. Ports Statistics
The Ports Statistics page contains the following fields:
•
Unit No.
— Selects the port to be displayed.
•
Interface Statistics
— Selects Interface Statistics when clicked, and specifies the type of interface
statistics to graph from the drop-down menu. The default is Received Rate (MFrame Bits/sec).
•
Etherlike Statistics
— Selects Etherlike Statistics when clicked, and specifies the type of etherlike
statistics to graph from the drop-down menu. The default is Frame Check Sequence (FCS) Errors.
•
RMON Statistics
— Selects RMON Statistics when clicked, and specifies the type of RMON statistics
to graph from the drop-down menu. The default is Drop Events.
 Loading...