6-2
Overview, continued
View data icons
(continued)
Action... Result...
2nd: If monitoring is on, the
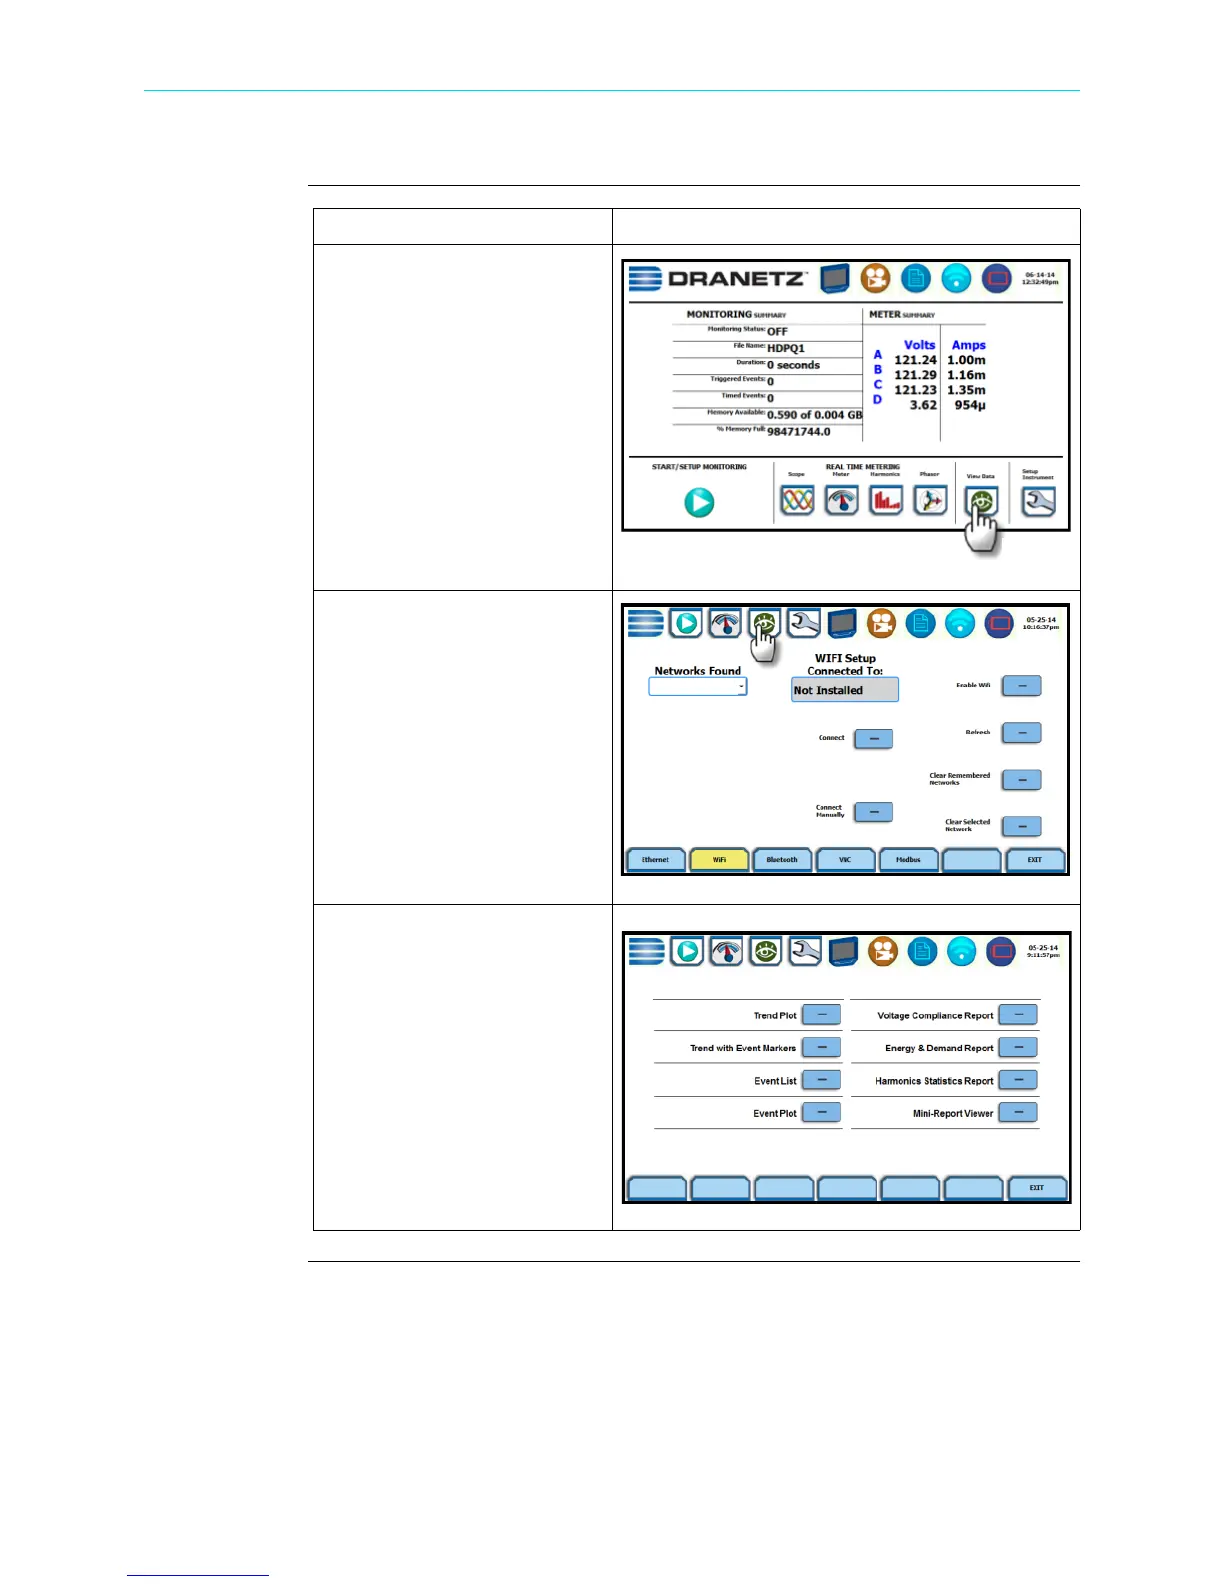
Home Monitoring page
becomes the start-up page.
The View Data icon is
available on the lower right
corner of the screen. View Data
brings up the Event Data &
Reports menu. Proceed to Step
2.
3rd: Recorded Data icon is
also accessible on the taskbar of
most typical screens, where
shortcuts to common
instrument functions are found.
Example: You can access
Recorded Data from the taskbar
of the Communications setup
screen.
STEP 2: The Event Data &
Reports menu contains
selections for Trend Plot, Trend
with Event Markers, Event List,
Event Plot, Voltage Compliance
Report, Energy & Demand
Report, Harmonics Statistics
Report and Mini-Report
Viewer. Refer to the particular
section for information on each
function.
HDPQ-111c
HDPQ-302
HDPQ-601
Shop for Power Metering products online at:
1.877.766.5412
www.PowerMeterStore.com

 Loading...