6-3
CH 6/ View Event Data & Reports
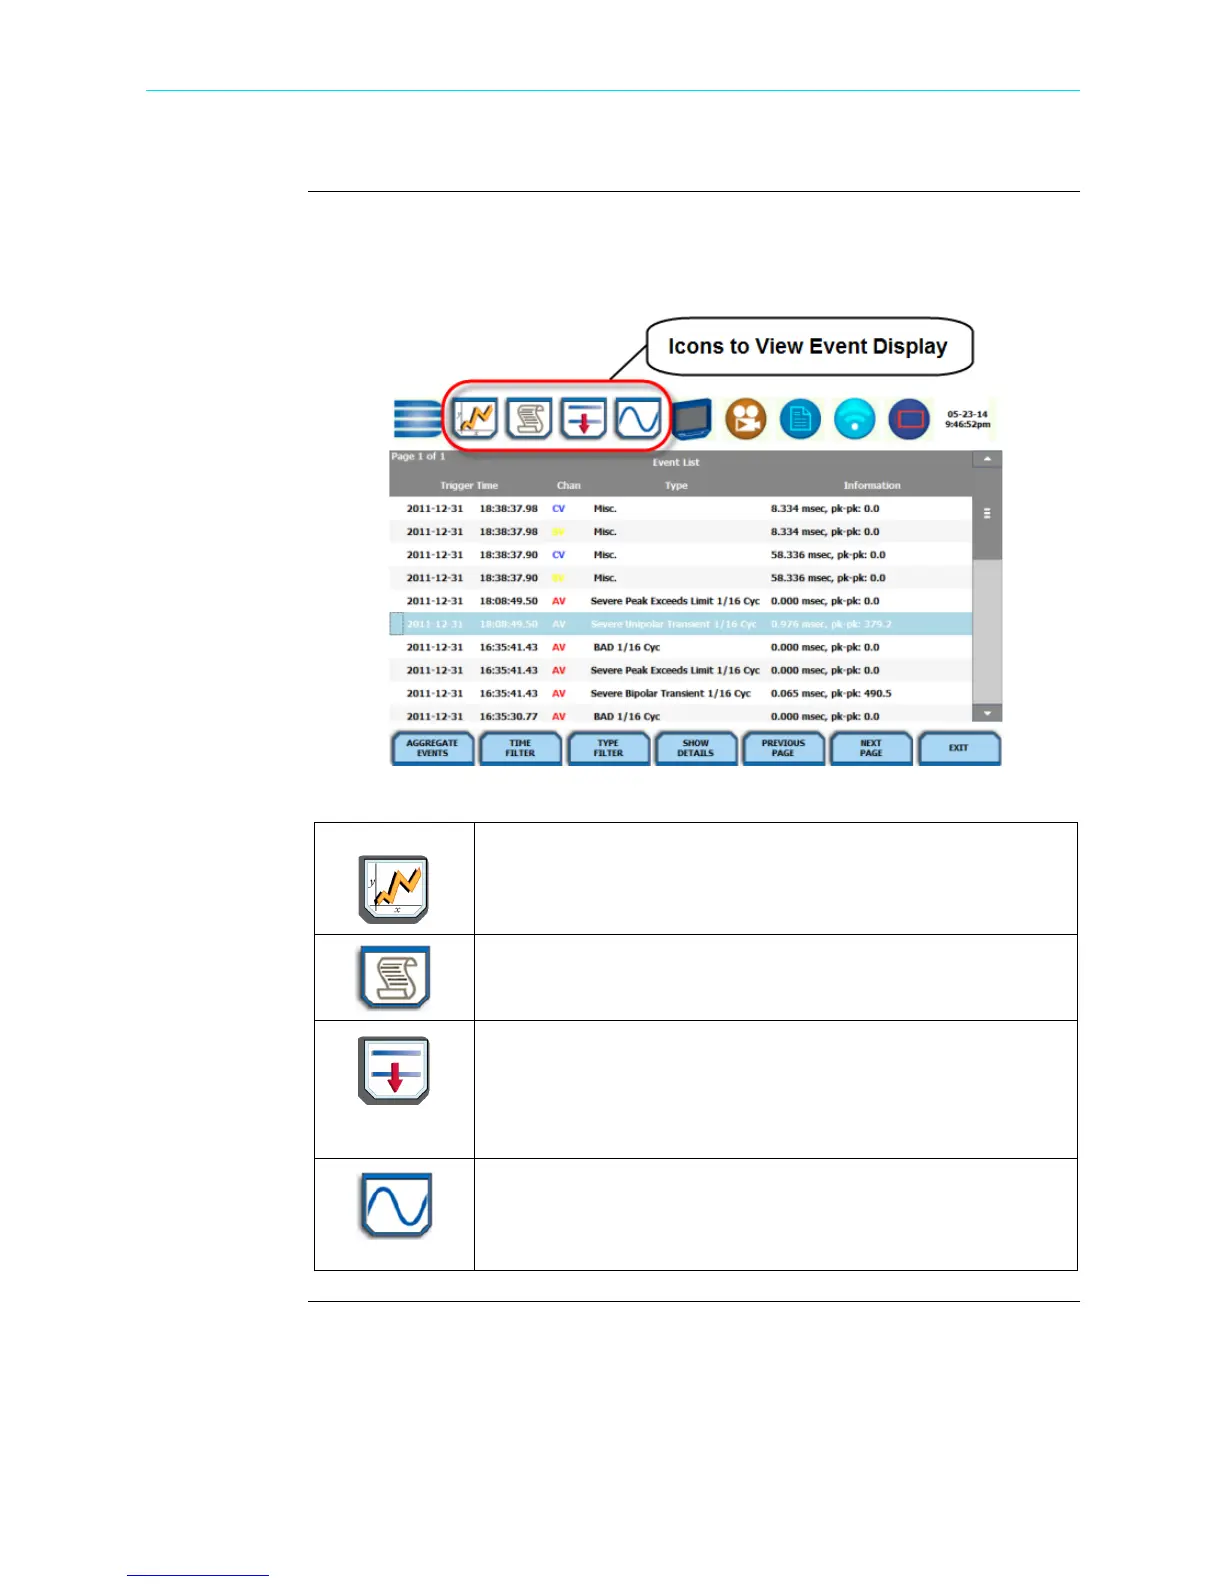
Taskbar icons to
view events
Once you bring up an event screen, the taskbar changes to show specialized icons that
provide easy access to view event display. These icons are not common to all screens,
only to event data screens. Sample screen shown below.
Trend Plot
Displays time plots or trend visualizations of journalled data. See
Section A Trend - Trend Plot.
Event List
Presents a summary of all captured events in the order that they
occurred. See Section B Event - Event List.
Event Plot (rms)
Shows the voltage and current rms plots recorded for the event.
Threshold values and event details can be displayed using the
corresponding function keys. See Section B Event - Event Plot -
RMS.
Event Waveform
Shows the voltage and current waveforms that were captured with
the event, based on user settings. See Section B Event - Event
Waveform.
HDPQ-620
Shop for Power Metering products online at:
1.877.766.5412
www.PowerMeterStore.com

 Loading...