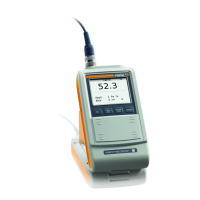
Page 206 Operator‘s Manual FERITSCOPE
®
FMP30
Glossary
Countrate
Digitized form of the measurement signal, which is proportional to the
-ferrite content and is produced in the probe by the -ferrite content. The
larger the -ferrite content is, the smaller is the countrate. Calibration
curve (characteristics)
The numeric values of the normalized countrate Xn range between 0
and 1, and are calculated according to the following equation:
where:Xn = normalized countrate
X = count rate measured on the specimen
X
Base
= countrate measured on the Base of the calibration standard set
Xs = countrate measured on a specimen with no
-ferrite content
C.O.V.
Coefficient of variation. The standard deviation of a measurement series
in percentage points, i.e., the standard deviation in reference to the
mean value. For many manufacturing processes, C.O.V. [%] is a char-
acteristic process constant. A change in a parameter during the coating
process can alter C.O.V. [%] significantly; thus, a sudden change of
C.O.V. [%] indicates a change in the process conditions. C.O.V. [%] is
calculated as follows:
where:COV = coefficient of variation
Fe. = mean value
s = standard deviation
Cp Process capability index
Cpk Process capability index
CR (Carriage Return) Carriage Return (CR)
Curvature
Excess and Kurtosis are measures for the curvature (e.g., how pointed
or how wide) of a distribution compared to a normal distribution. A pos-
itive curvature indicates a relatively narrow, pointed distribution. A neg-
ative curvature indicates a relatively flat distribution. The curvature of a
normal distribution is Zero. When evaluating the open Application with
n
XX
Base
–
Xs X
Base
–
---------------------------=
V
s
Fe.
-------- 100= %

 Loading...