Chapter 5. Logging Data
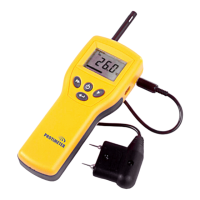
90 Model PM880 Portable Hygrometer User’s Manual
5.7.1 Using the Graph Format (cont.)
5.7.1c Adjusting the Graph Scale
1. The Y-Axis window appears. Use the arrow keys to scroll to one of the
following and press
[ENTER]:
• Max - the graph extends to highest logged value.
• Range - the graph extends from the lowest to the highest logged
value.
• Set - the graph extends between a specified minimum and maximum
value.
2. Do one of the following:
• If you selected Max or Range, proceed to step 6.
• If you selected Set, proceed to the next step.
3. Use the arrow keys to scroll to the Minimum text box and press
[ENTER].
4. Use the numeric keys to enter the desired value and press [ENTER].
5. Repeat steps 3 and 4 to enter the Maximum value.
6. When you have finished, press [F3] (OK) to exit and view the graph.
Next, do one of the following:
• To return to the Log Manager and view another log, press [F3] (Exit)
and then press
[MENU]. Return to Using the Graph Format on
page 88.
• To view logs using the spreadsheet format, press [F3] (Exit), then
press
[MENU] and proceed to Using the Spreadsheet Format on
page 92.
• To exit and return to taking measurements, press [F3] (Exit) twice and
then press
[MENU].
 Loading...