13
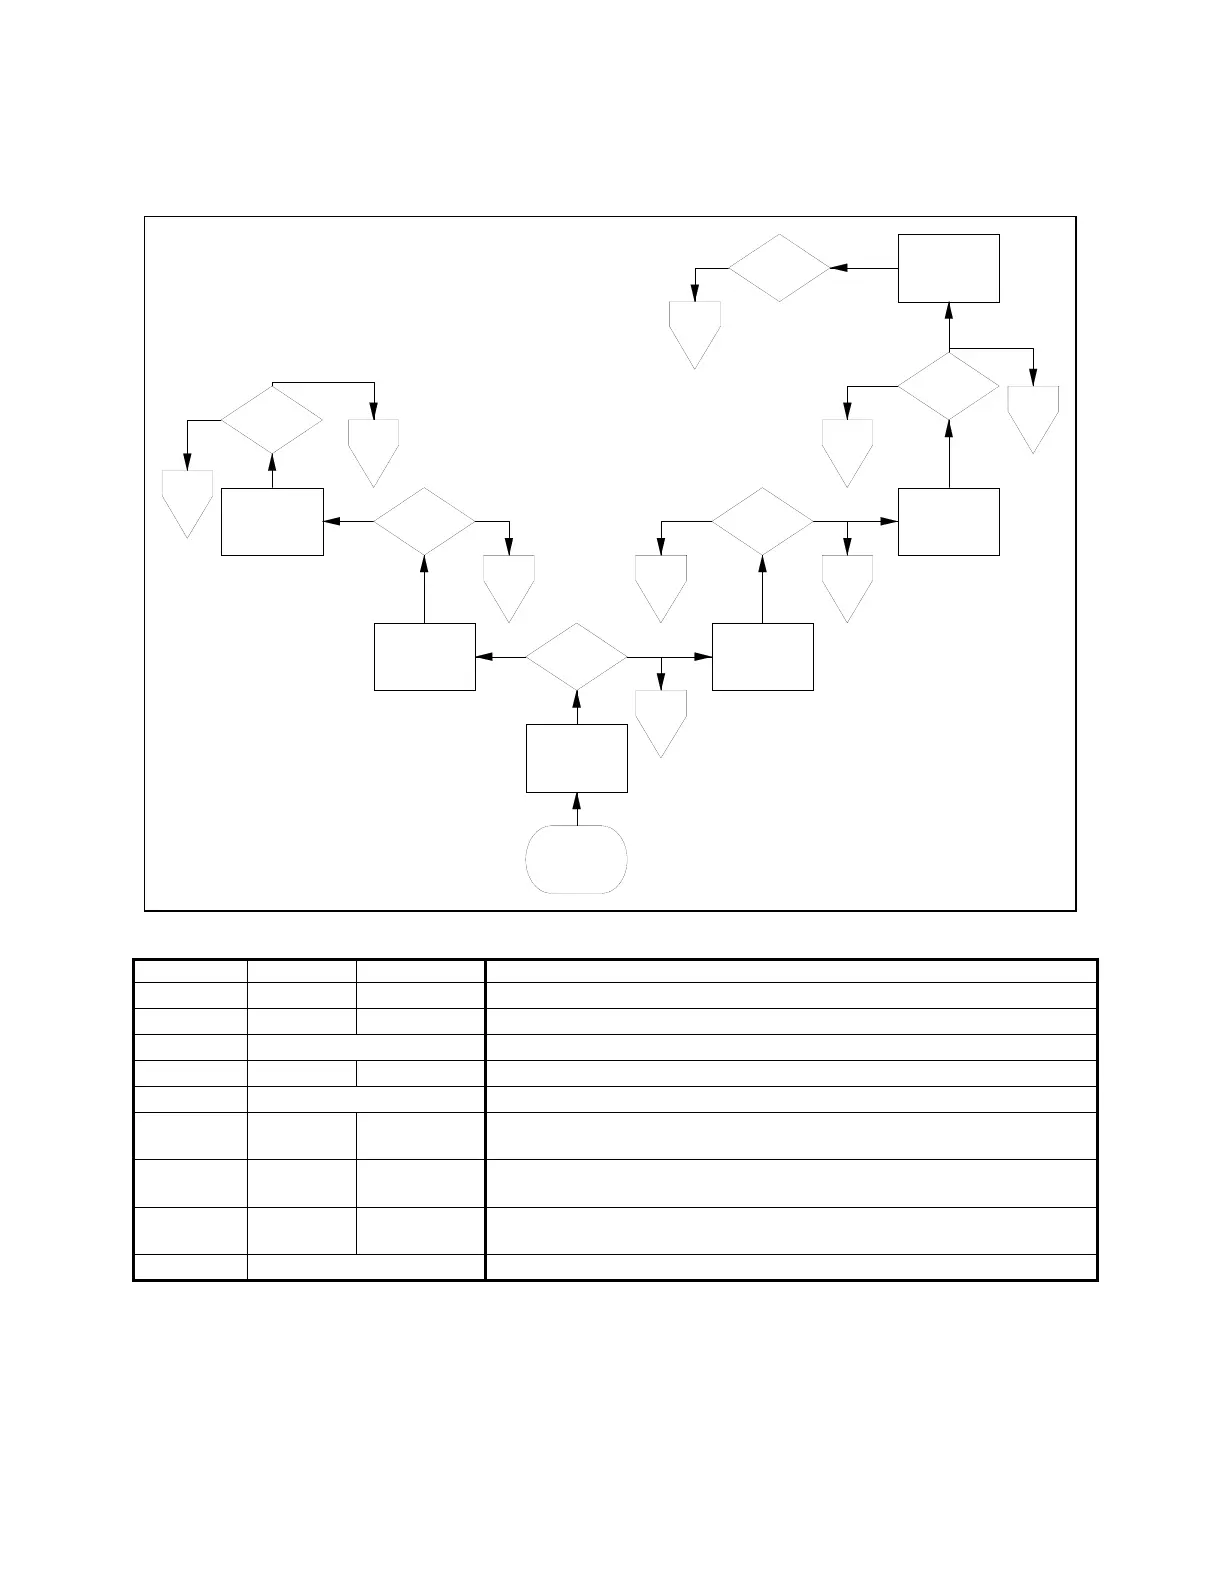
Figure 2 is an example of the test decision tree and statements you can make based on the test results. It is
based on a detector with the stated sensitivity of 3.0± 0.5 %/ft.
Figure 2, Example of Test Decision Tree and Statement of Results
Start
Test
3.0
Alarm
A
Test
2.5
Test
3.5
Alarm
Alarm
Alarm
Alarm
Test
3.9
Test
1.0
Test
2.1
B C
D
E
G
J
Alarm
F
H
YesNo
No Yes
Yes
YesNo
No
Yes
Yes
No
Statement Alarm at Not Alarm at
Statement of Test Results
A 3.0 %/ft
Is within manufacturer's specification of 3.0 ± 0.5%/ft
B 3.0 %/ft 2.5 %/ft
Is within manufacturer's specification of 3.0 ± 0.5%/ft
C 3.0 %/ft and 2.5 %/ft
Is within manufacturer's specification of 3.0 ± 0.5%/ft
D 2.5 %/ft
2.1 %/ft
Is within manufacturer's specification of 3.0 ± 0.5%/ft
E 3.5 %/ft and 3.0 %/ft
Is within manufacturer's specification of 3.0 ± 0.5%/ft
F 2.1 %/ft Is a borderline case. Outside manufacturer's specification.
Within test error
G 3.9 %/ft Is a borderline case. Outside manufacturer's specification.
Within test error
H 3.9 %/ft Is above the upper limit of manufacturer's specification and
outside of test error
J At or below 1.0%/ft Is outside of the manufacturer's range. Subject to false alarm