52
English
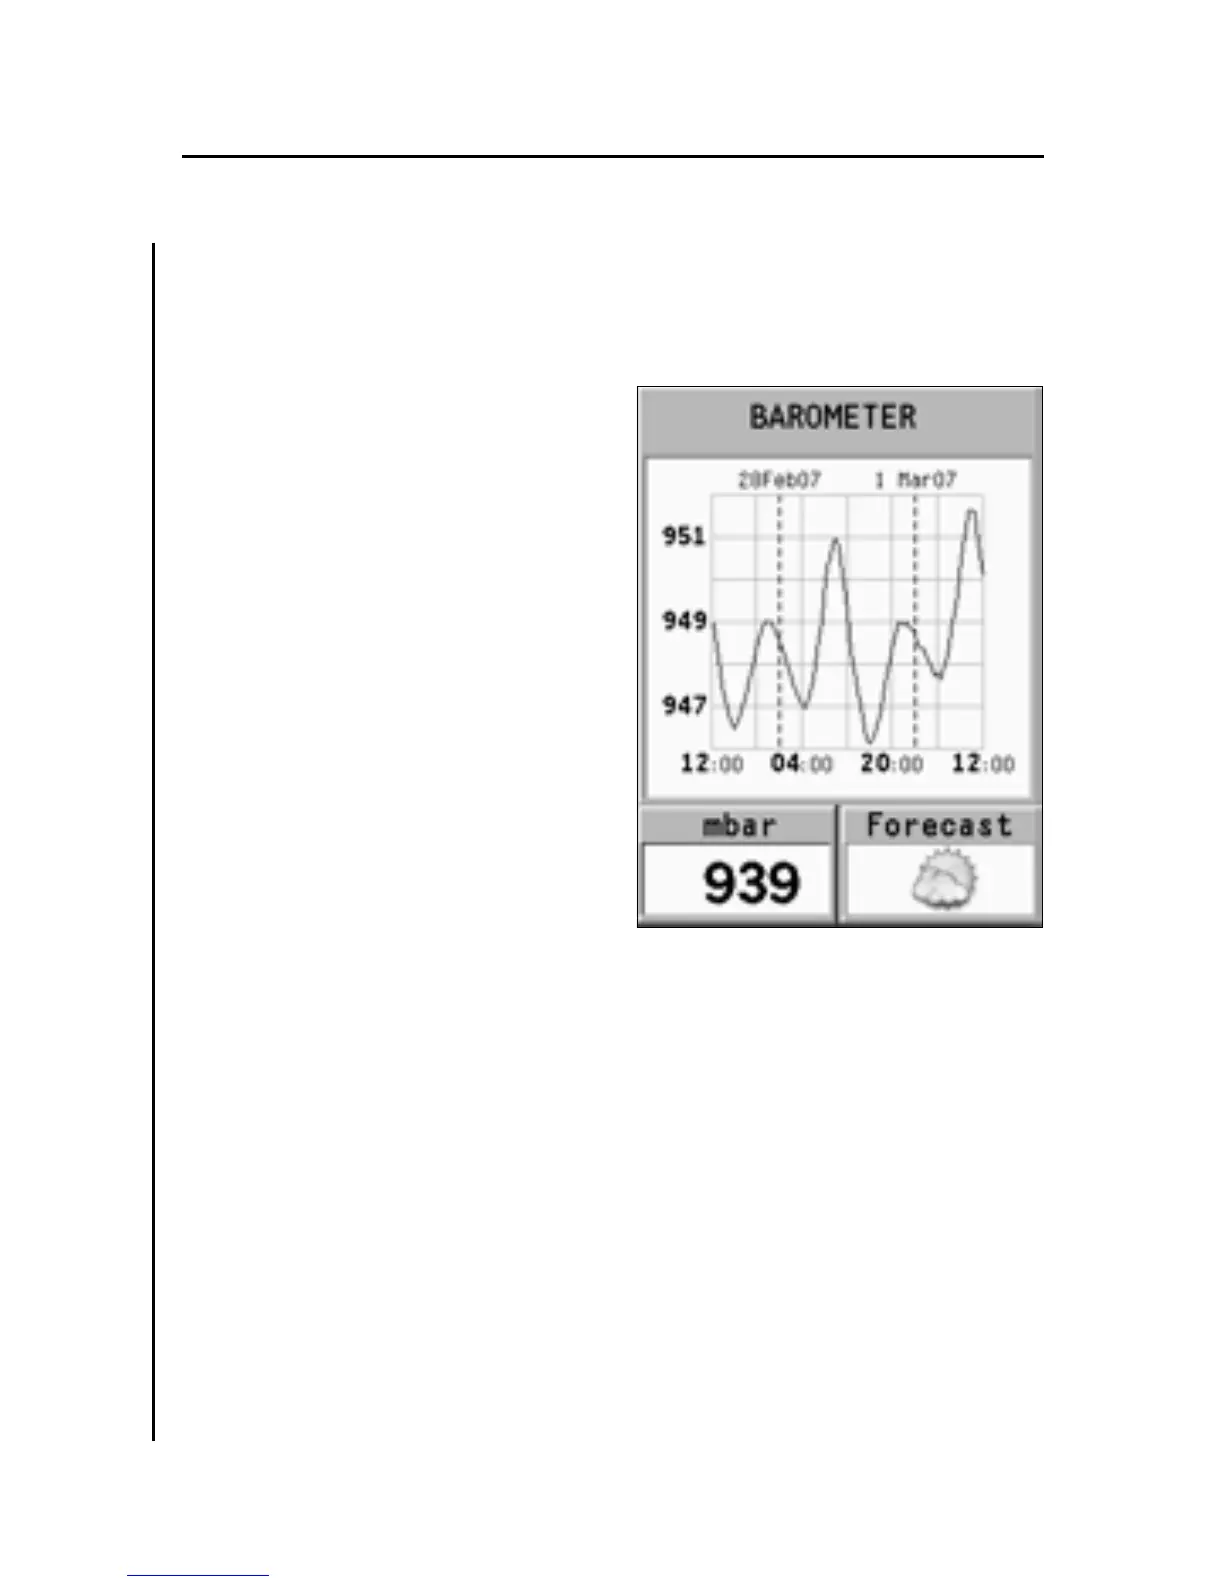
BAROMETER WINDOW
This window shows the following data:
• Historical graph showing
the barometric pressure mea-
sured during the latest 48
hours
• Atmospheric pressure cur-
rent value
• Weather forecast
In order that pressure graph,
and consequently weather fore-
cast data are significant, the
unit must be maintained in the
same position and, above all, at
constant altitude.
Changes in altitude cause
changes in atmospheric pres-
sure that, in addition to weather
changes, make pressure data unusable for weather forecast.
The unit verifies this condition and will not show the pres-
sure graph if altitude has changed considerably.
It is possible to improve the accuracy of weather forecast by
setting the altitude – when known – in the SETUP, NAVIGA-
TION menu. The weather forecast is based only on the local
atmospheric pressure and its variations; therefore it is less
reliable than official forecasts that are based on the data pro-
vided by weather stations and satellites.
Since the pressure historical graph is kept up-to-date even
when the unit is switched off, the graph is always available
under normal operating conditions. Only when the battery is
Barometer Window
3S