RCS User Manual
74
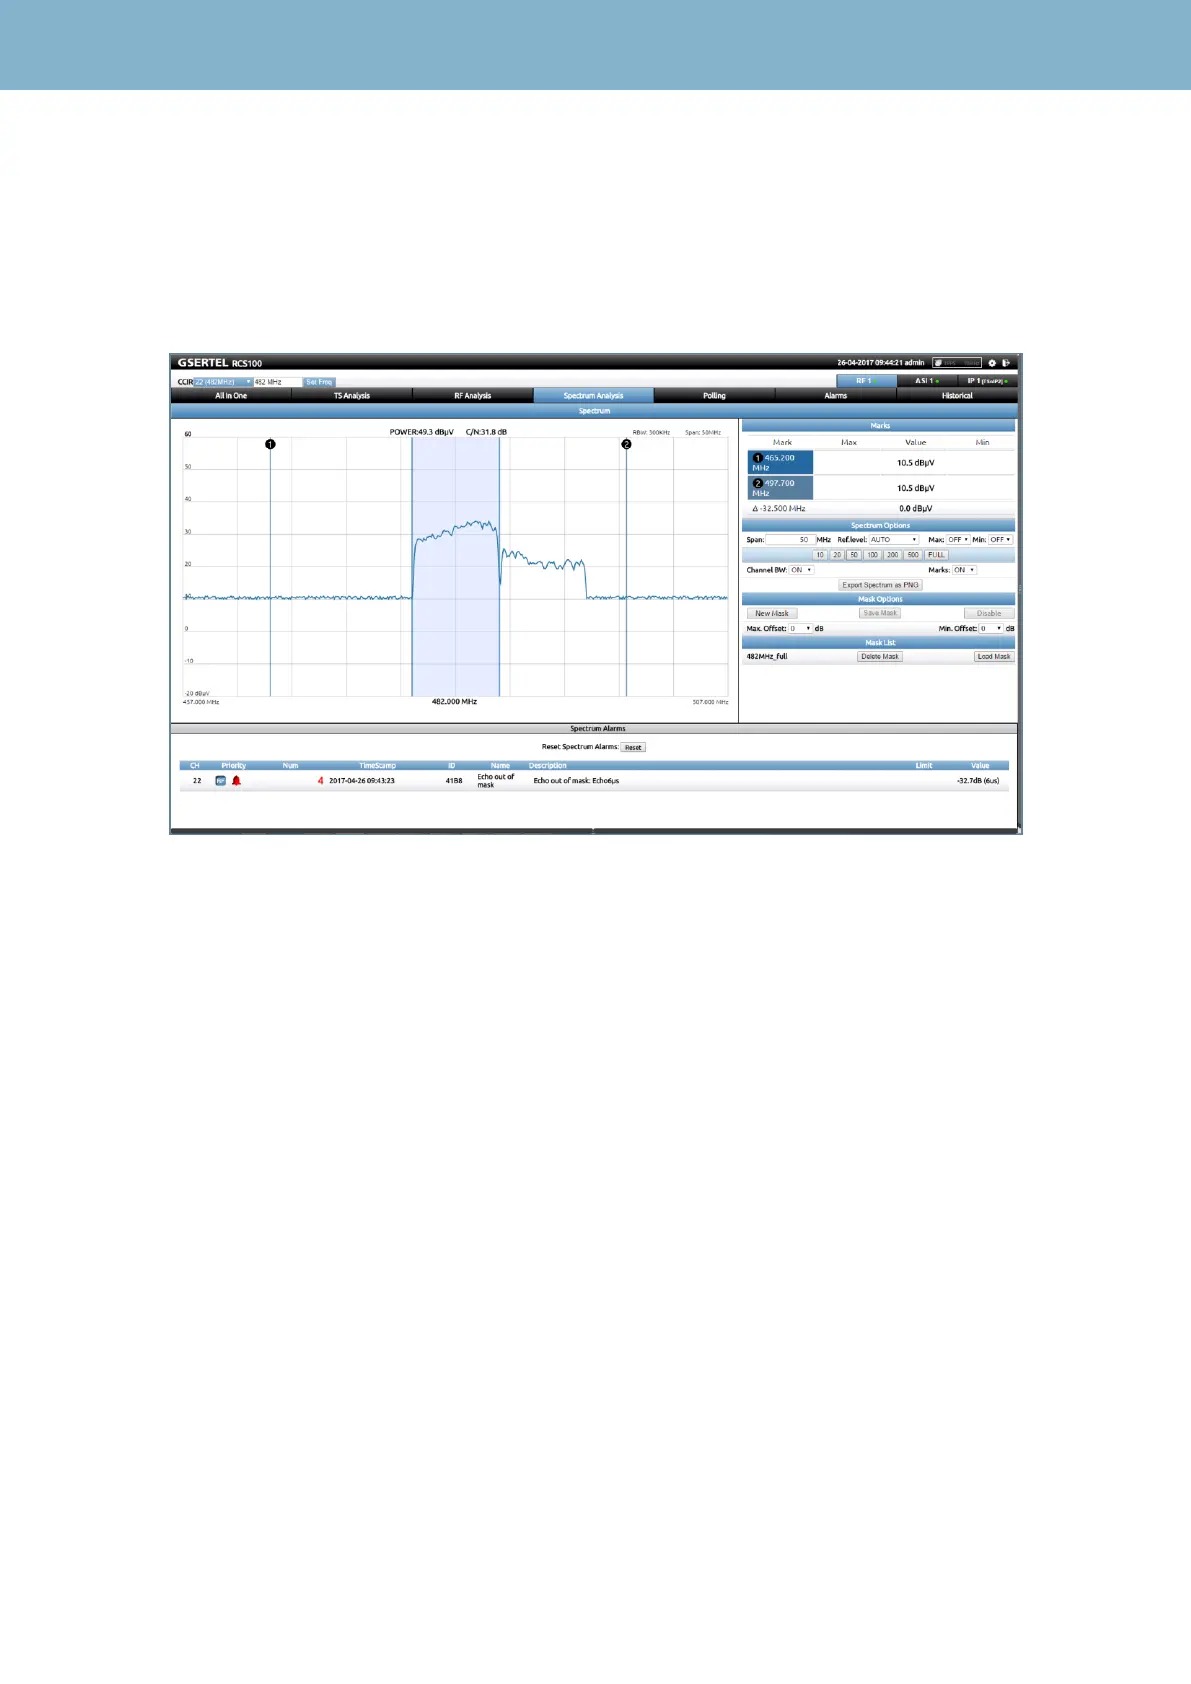
6.- Spectrum -Option 902511 only for RCS100 and RCS400-
This feature is available only when the input selected is RF.
This feature shows the spectrum of the selected signal.
In the left side of the screen, you can see the signal spectrum. The reference level is automatically
selected according to the signal level.
The measurements of the selected channel (Power and C/N) are shown above the spectrum graph,
as well as the RBW and the span.
The start, centre and end frequency are shown below the graph. The user can enter a numeric
value by clicking on them and using the keyboard.
Marks: As you can see in the image above, there are two markers in the spectrum that the user can
move to see the signal level in a particular frequency. The measurements corresponding to the
markers and the level difference between them (Delta function) are shown on the right side of the
screen. The user can also select the frequencies of the markers using the numeric keypad, for that
you must click on the box in the table on the right.
Spectrum options: The spectrum options are shown below the markers measurements:
*Span: The user can select one of the predefined by clicking on the corresponding button.
*Reference Level: Allows to select the reference level value.
*Maximum and minimum: Enables/disables the max. and min. graphs:
 Loading...