AutoCAT 9000 Validation Study
AutoCAT 9000 Validation Study
Page 164
50081_AutoCAT 9000 Validation Study.fm
Testing was also conducted to determine the precision of these methods at a variety of
concentrations. The results of these studies are shown in Tab le 3, and represent the
variability of results from seven replicate analyses, covering the 0–5 mg/L measurement
range, at the 95% confidence interval.
Analysis Guidelines
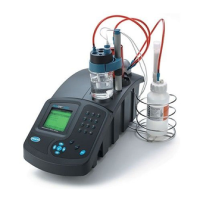
When using an autotitrator for amperometric determinations of chlorine at the various
concentrations typically found in power plants, including low µg/L concentrations in the
final discharge waters and post dechlorination upstream of RO systems, in addition to the
higher mg/L concentrations required for cooling water biofouling control, it is important
that the operator have dedicated glassware for each sampling point in order to prevent
sample carryover, which could otherwise result in falsely high readings where low
concentration determinations are required.
Accuracy in measuring the sample volume will be facilitated by the use of 200-mL
Kohlrausch Class A volumetric flasks. Originally developed for the determination of
sugar content in sugar beets, these volumetric flasks differ from standard volumetric
flasks in that they have a wide mouth, which makes it easier to transfer samples quickly
to the titration beaker, without excessive chlorine loss. The sample volume accuracy
achieved by using the Kohlrausch flask is much better than that achieved by using a
graduated cylinder.
Electrode fouling can occur, especially when amperometric titration is conducted in
wastewater effluent. In amperometric titrators that employ a single platinum electrode in
conjunction with a reference electrode, it is important not only that the platinum
Total Chlorine Back
Drinking Water
Free Cl
2
at 0.465 mg/L
97.3 (n=4) 95.8—99.1
Denitrified WasteWater
Effluent (Source #1)
NH
2
Cl
at 0.423 mg/L
87.23 (n=4) 73.5—94.8
at 0.844 mg/L 93.09 (n=3) 91.8—93.8
at 1.262 mg/L 88.56 (n=3) 85.3—91.9
Denitrified WasteWater
Effluent (Source #2)
NH
2
Cl
at 0.423 mg/L
92.59 (n=3) 88.9—97.2
at 0.844 mg/L 98.06 (n=3) 96.8—98.8
at 1.262 mg/L 95.01 (n=3) 89.9—98.0
Table 2 Percent Recovery in Drinking Water and Wastewater (continued)
Method Sample Type Spike Level, mg/L Cl
2
Average %
Recovery
% Recovery Range
Table 3 Precision
Method Concentration (mg/L Cl
2
) 95% Confidence Limits (mg/L Cl
2
)
Free Chlorine
0.277 0.251–0.303
1.924 1.778–2.070
4.942 4.650–5.234
Total Chlorine Forward Titration
0.0090 0.0084–0.0096
0.423 0.413–0.433
4.241 4.165–4.317
Total Chlorine Back Titration
0.023 0.020–0.026
0.398 0.370–0.426
1.313 1.287–1.339
4.751 4.689–4.813
 Loading...