Performance and curves diagrams
Domestic air conditioner
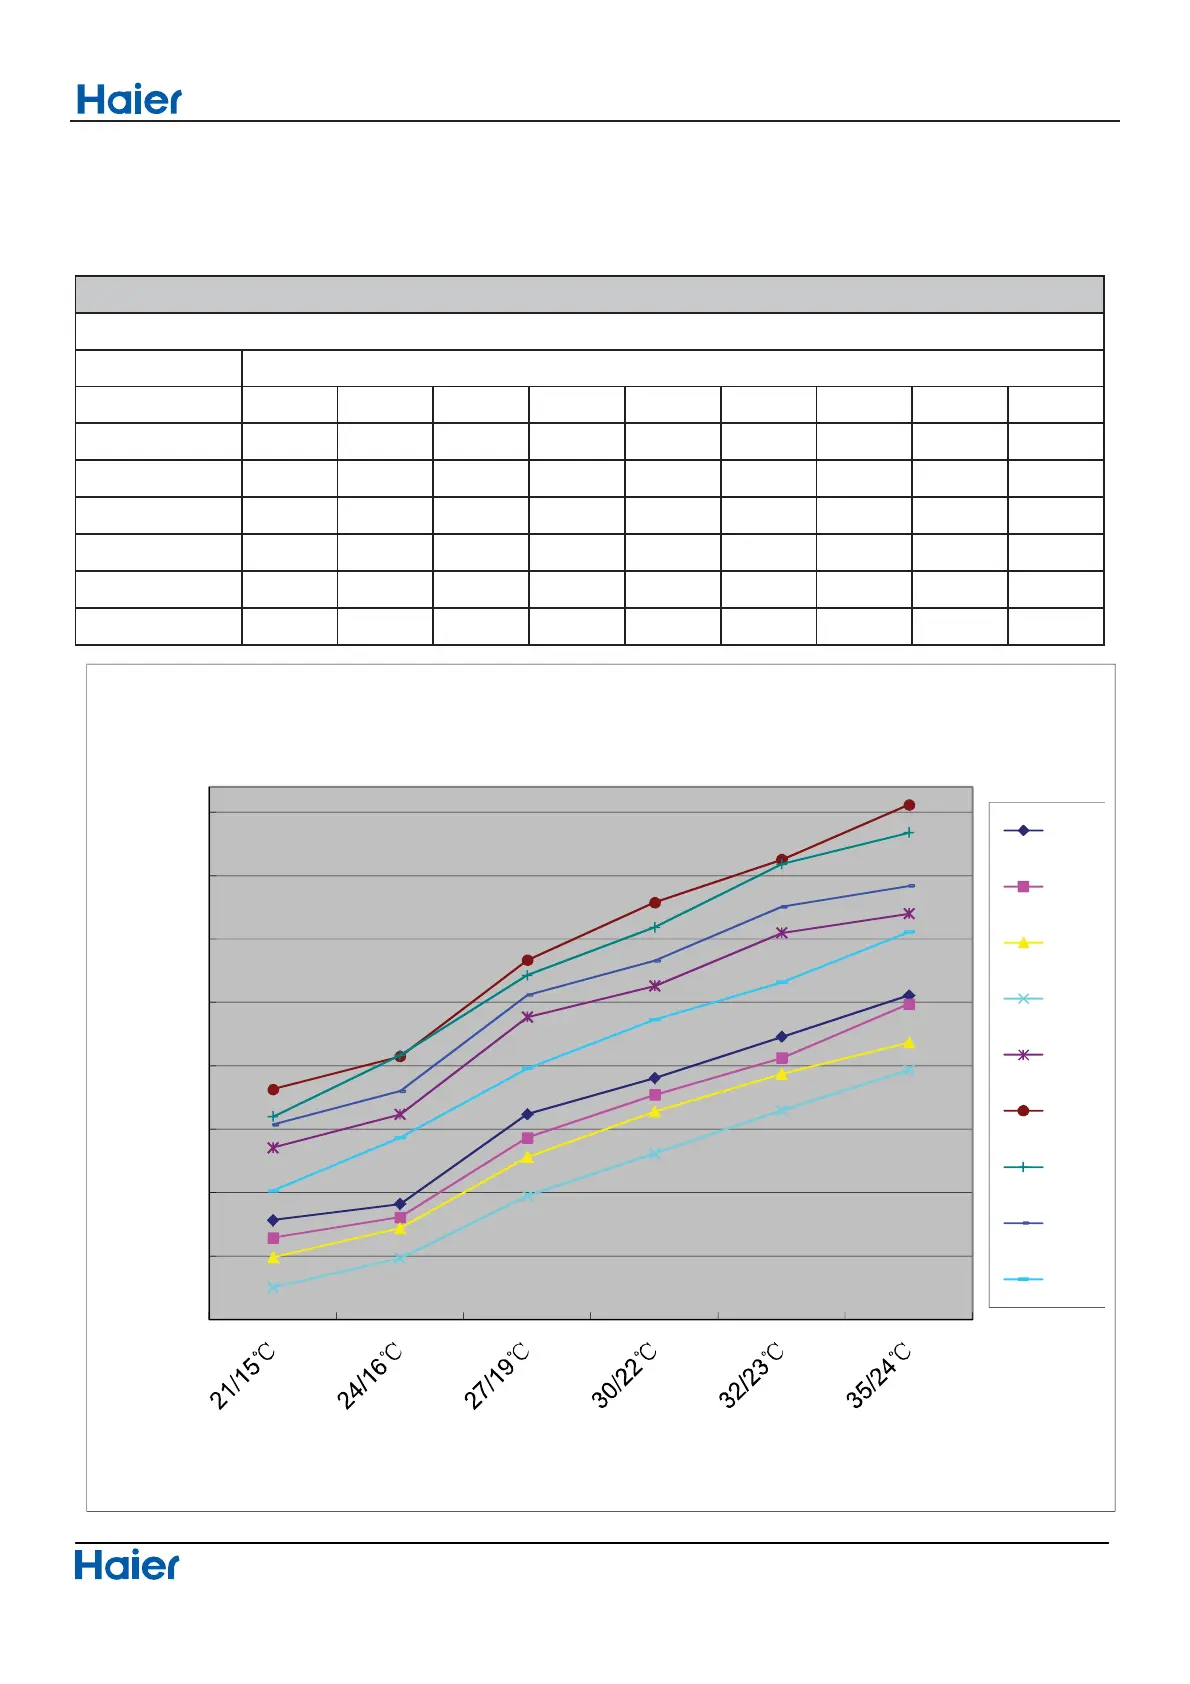
11.Performence and curves diagrams
11.1 Cooling capacity-temperature curves
48
indoor temp.
DB/WB
10ć 15ć 20ć 25ć 30ć 35ć 38ć 40ć 43ć
21/15ć
5084 4945 4791 4552 5656 6116 5898 5836 5314
24/16ć
5210 5107 5019 4782 5917 6375 6384 6101 5734
27/19ć
5920 5734 5582 5275 6685 7135 7016 6858 6281
30/22ć
6204 6072 5940 5610 6930 7590 7392 7128 6666
32/23ć
6529 6364 6236 5950 7350 7928 7892 7555 6960
35/24ć
6856 6788 6484 6268 7501 8360 8139 7720 7357
cooling value-temerature table
performance curves
outdoor temp.
4300
4800
5300
5800
6300
6800
7300
7800
8300
cooling capacity (W)
cooling capacity and indoor/outdoor temp.curves
10ć
15ć
20ć
25ć
30ć
35ć
38ć
40ć
43ć
indoor temp.(DB/WB)
 Loading...