HISTOGRAM EXPOSURE MODE
Histogram Exposure
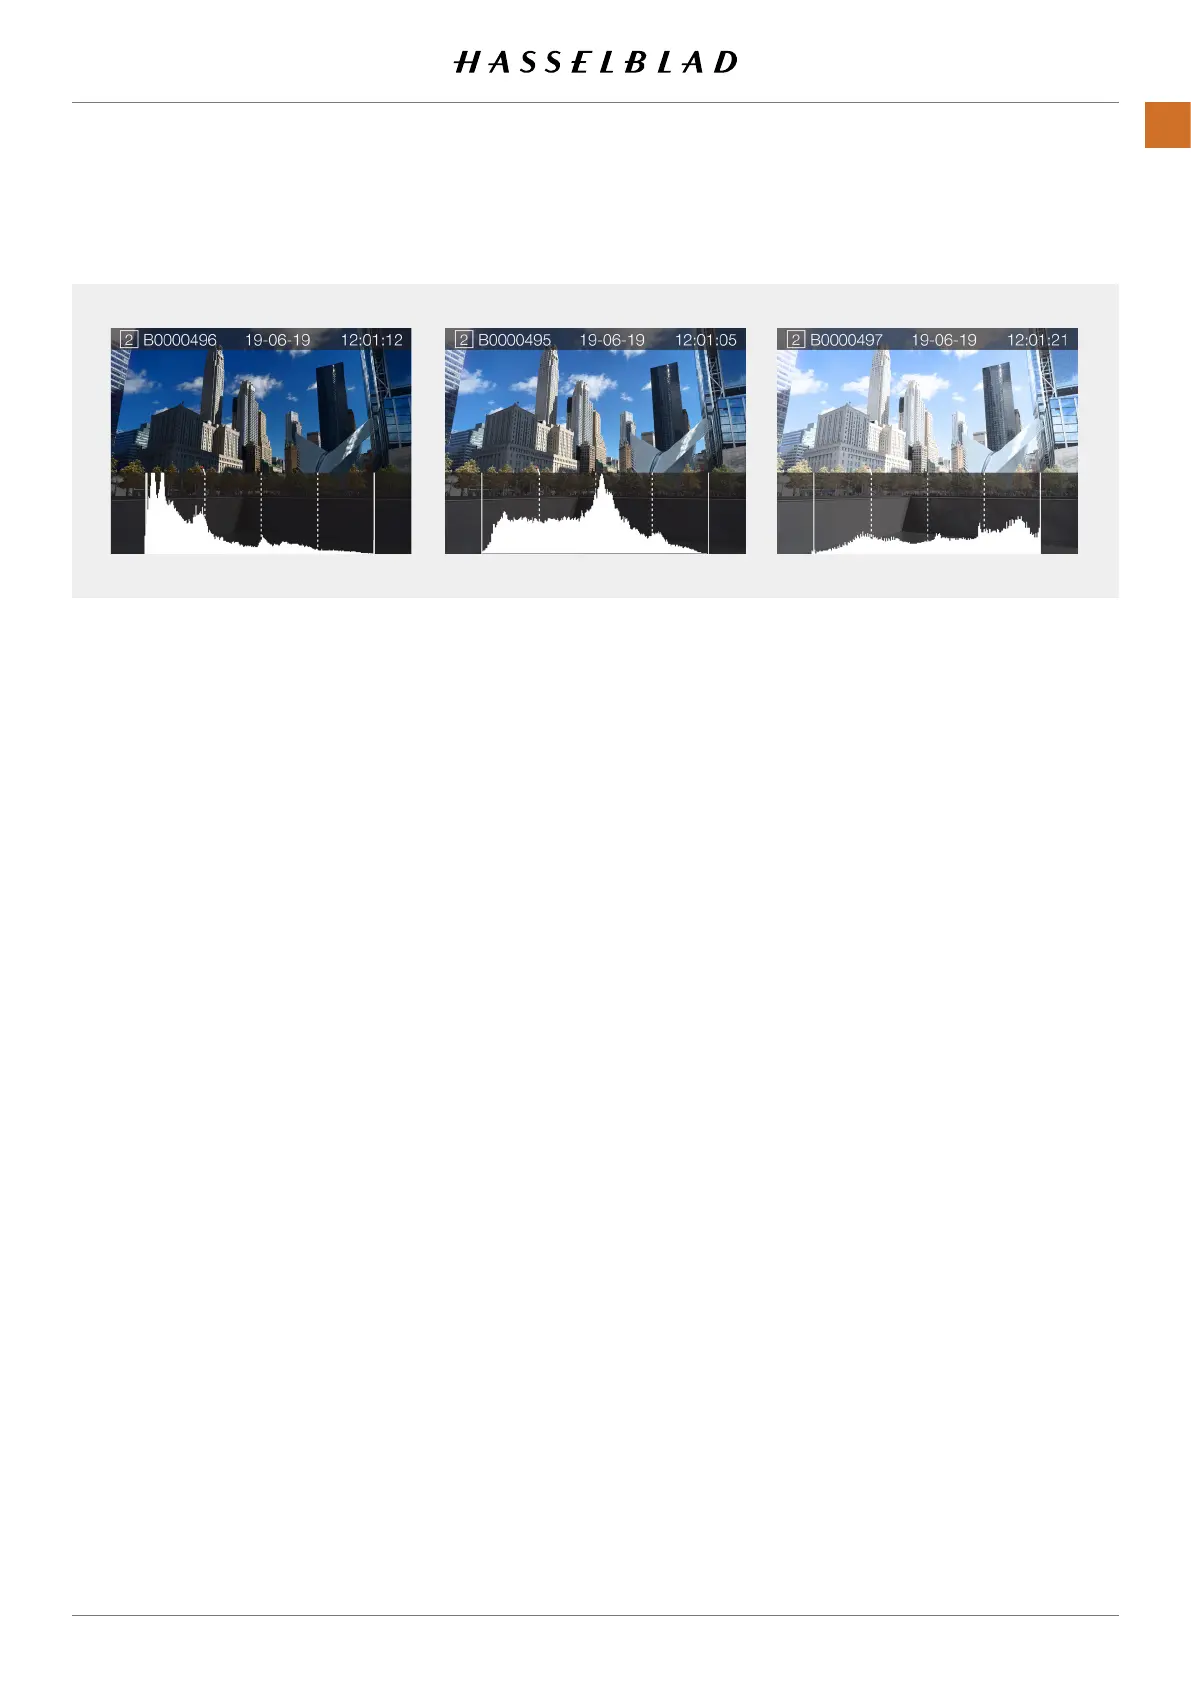
The Histogram provides a graph that indicates the total
number of pixels at each brightness level, with brightness
in range from black on the left to white on the right. It is a
valuable tool for evaluating captures.
A well exposed shot usually has a full range of levels, while
underexposed and overexposed Captures tend to show levels
concentrated at the left or right part of the scale.
The histogram is only an indicator that should be interpreted.
There are several situations in which a ‘bad’ histogram will
match an exposure that could be perfect for the intended
effect.
Study the Histogram examples and the explanations below.
Underexposure
Histogram display concentrated on the left with few pixels
elsewhere indicates a likely underexposure. Many details will
be lost in the shadows.
Even exposure
Histogram display spread across the full range indicates a
likely good exposure. There may still be a few pixels at the
extremes, indicating a few spectral highlights and saturated
shadows, but this is often normal in a good exposure.
Overexposure
Histogram display concentrated on the right with few pixels
elsewhere indicates a likely overexposure. Many details will be
lost in the highlights.
Underexposure Even exposure Overexposure
X1D II 50C USER GUIDE www.hasselblad.com
87
FUNCTIONS
Contents
 Loading...