23
3. OPERATING PROCEDURE [How to Use the Liquid Crystal Display (LCD)]
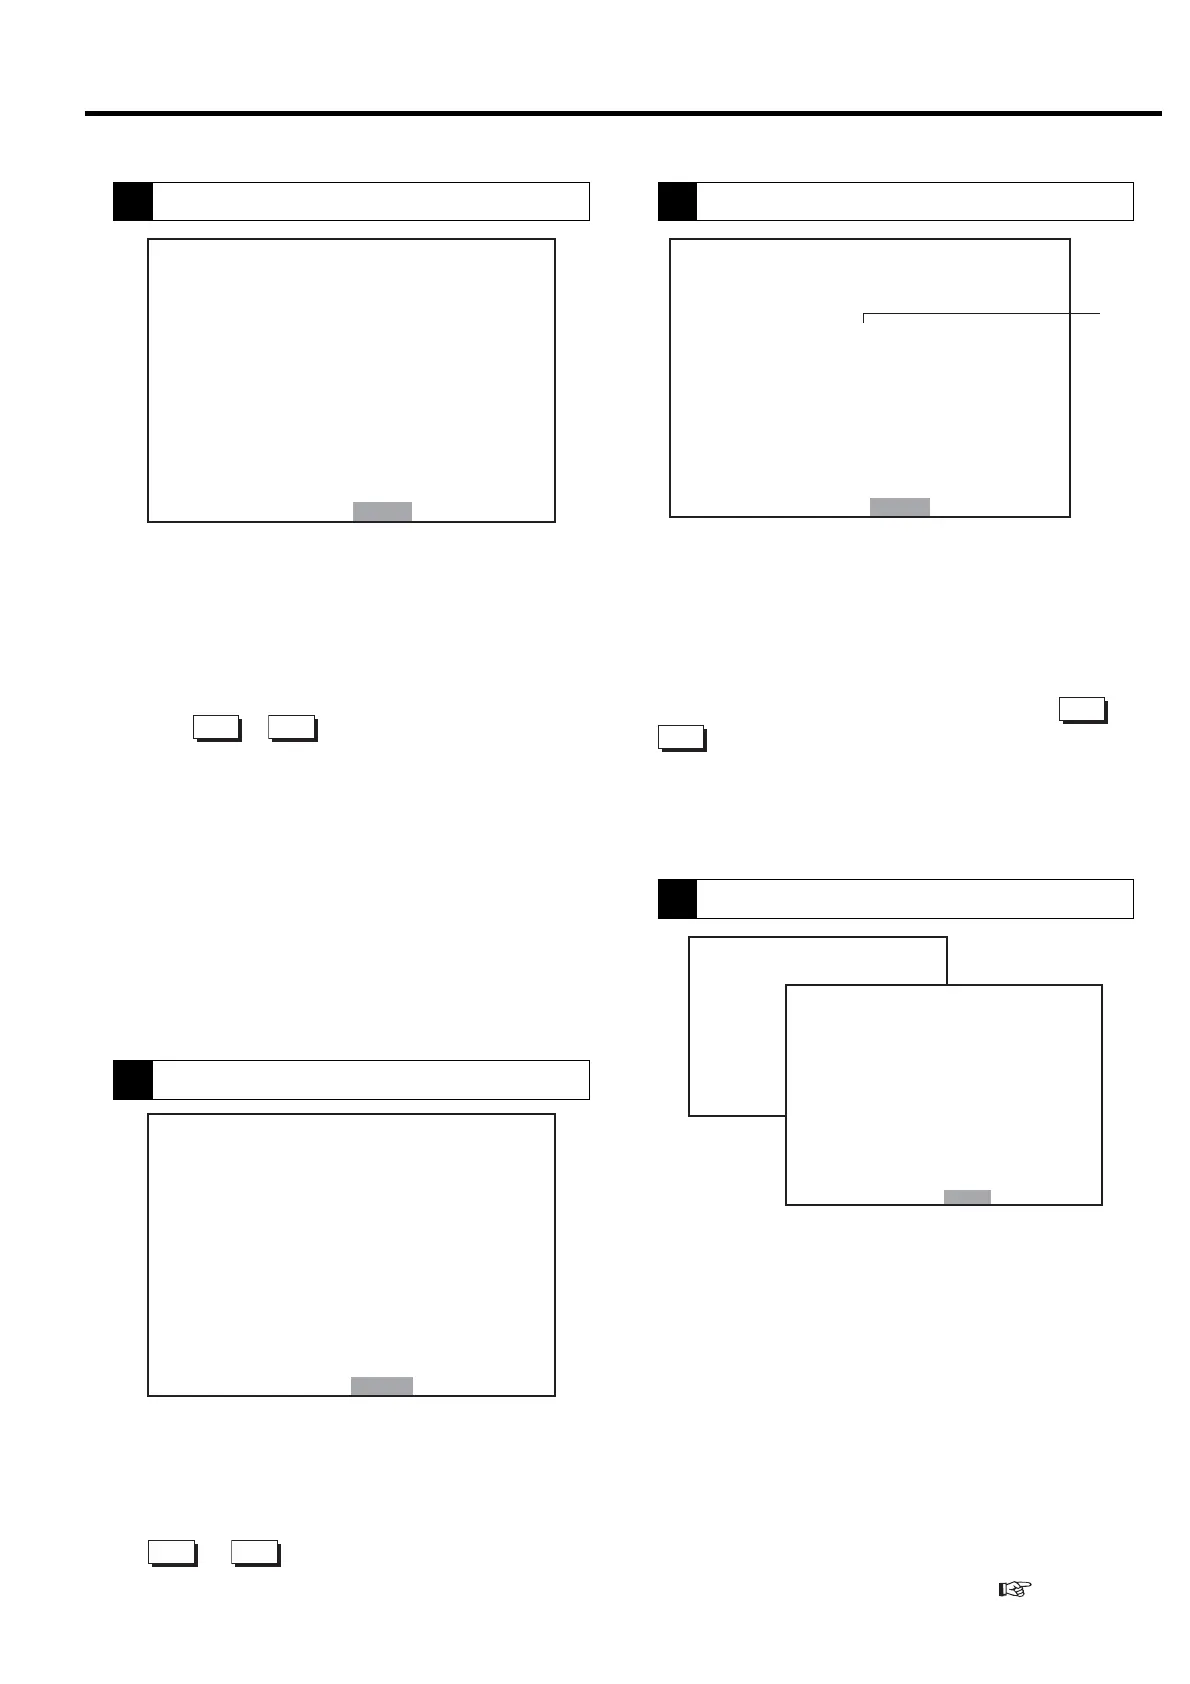
This display shows a maximum of 6 alarms and
displays the following information as such: type of
alarm, the number of times, and the date and time. If
the same alarm occurs in a short period of time, the
older data is deleted and the more recent data is stored,
and alarm NOS. is updated. The most recent data is
arranged at the top of the display. Press the
△
or
▽
button to move within the display.
① Indicates operating condition.
L: When loading, U: When unloading,
S: When Stopped
㼇㻭㻸㻭㻾㻹 㻴㻵㻿㼀㻻㻾㼅㼉
㻝䠊 㼍㼍㼍㼍㼍㼍㼍㼍㼍㼍㼍㼍㼍
㻯㻻㻰㻱䠖㻞㻝㻸 㻺㻻㻿䠊䠖㻌 㻝
㻜㻣䠋㻜㻤䠋㻜㻝 㻝㻥䠖 㻞㻢
㻞䠊 㻖㻖㻖㻖㻖㻖㻖㻖㻖㻖㻖㻖㻖
㻯㻻㻰㻱䠖㻖㻖㻖 㻺㻻㻿䠊䠖㻖㻖
㻖㻖䠋㻖㻖䠋㻖㻖 㻖㻖䠖 㻖㻖
㻟䠊 㻖㻖㻖㻖㻖㻖㻖㻖㻖㻖㻖㻖㻖
㻯㻻㻰㻱䠖㻖㻖㻖 㻺㻻㻿䠊䠖㻖㻖
㻖㻖䠋㻖㻖䠋㻖㻖 㻖㻖䠖 㻖㻖
㻹㻻㻺 䠖 㻮 㻭㻯㻷
①
㼇㻸㻻㻭㻰 㻰㻭㼀㻭㼉
㻝䠊㻜㻤䠋㻜㻝
㻭㼂㻳䠊㻼㻾㻱㻿㻿䠖 㻌 㻌 㻣 㻡 㼜 㼟 㼕
㻭㼂㻳䠊㻯㼁㻾㻾㻱㻺㼀䠖 㻜 㻠 㻜䠝
㻭㼂㻳䠊㻸㻻㻭㻰 㻾㻭㼀㻱䠖㻜㻢㻡䠂
㻭㼂㻳䠊㻼䠫䠳䠡䠮䠖 㻌 㻝 㻣 㻚 㻤㼗㼃
㻞䠊㻜㻝䠋㻜㻝
㻭㼂㻳䠊㻼㻾㻱㻿㻿䠖 㻌 㻌 㻣 㻡 㼜 㼟 㼕
㻭㼂㻳䠊㻯㼁㻾㻾㻱㻺㼀䠖 㻜 㻠 㻜䠝
㻭㼂㻳䠊㻸㻻㻭㻰 㻾㻭㼀㻱䠖㻜㻢㻡䠂
㻭㼂㻳䠊㻼䠫䠳䠡䠮䠖 㻌 㻞 㻟 㻚㻤 㼗㼃
㻹㻻㻺 䠖 㻮㻭㻯㻷
㻡
㼇㻻㻼㻱㻾㻭㼀㻵㻻㻺 㻰㻭㼀㻭㼉
㻝䠊㻜㻤䠋㻜㻝 㻝㻜䠖㻜㻜
㻼䠖㻜㻠㻢䚸㻜㻝㻥䚸㻜㻝㻢䚸㻖㻖㻖
㻯䠖 㻜
㼀䠖 㻞㻡䚸 㻟㻟䚸㻖㻖䚸㻖㻖䚸㻖㻖
㻸䠖 㻡㻥䚸㻝㻤䠊㻤
㻞䠊㼍 㼍䠋㼎㼎 㼏㼏䠖㼐㼐
㻼䠖㻖㻖㻖䚸㻖㻖㻖䚸㻖㻖㻖䚸㻖㻖㻖
㻯䠖㻖㻖㻖
㼀䠖㻖㻖㻖䚸㻖㻖㻖䚸㻖㻖䚸㻖㻖䚸㻖㻖
㻸䠖㻖㻖㻖䚸㻖㻖㻖㻖㻖
㻹㻻㻺 䠖 㻮㻭㻯㻷
This display shows a maximum of 6 shutdowns and
displays the following information as such: type of
shutdown, the number of times the air compressor has
shutdown, and the date and time of the shutdown. The
shutdown history display also shows the operation data
(pressure, temperature, current) sampled at the time of
shutdown.
To view the operation data sampled when the shutdown
occurred; in the shutdown history display, move to the
item number of the targeted shutdown to view. Press
the SET button to open the [DETAILS] display.
● How to clear the all alarm and shutdown histories.
Set the F041 on digital monitor “1”. (
3.4.2).
Data can be recorded for a maximum of twelve (12)
times. The 13th recorded data is automatically deleted
and the 1st recorded data is added. The most recent
data is arranged at the top of the display. If a change to
these settings is desired, the sampled data before the
settings change will be left as is and the new recorded
data will be applied after the change.
Press the
△
or
▽
button to move within the display.
1. and 2. : Indicates the MONTH / DAY HOUR: MINUTE.
P - Represents a pressure (psi) and indicates from left
to right: Discharge air pressure, Interstage
pressure, Oil pressure, ***
C - Represents an amperage current (A)
T - Represents a temperature (°F) and indicates from
left to right: 1st stage discharge air temperature,
2nd stage discharge air temperature, oil
temperature, ***, 2nd stage suction temperature.
L -Represents a load ratio percentage (%)
Unavailable fields are filled with asterisks.
This display shows the averaged load data per day. Data
can be recorded for a maximum of 6 days; the 7th day
of averaged load data is automatically deleted and the
1st or most recent averaged data is added. The most
recent data is arranged at the top of the display. Press
the
△
or
▽
button to move within the display.
Data is averaged from start to stop every day. If 24h
operation is done, data is averaged at AM 0:00.
㼇㻲㼁㻺㻯㼀㻵㻻㻺 㻹㻱㻺㼁㼉
㻝䠊㻮㻭㻿 㻵 㻯㻌 㻿㻱㼀㼁㻼
㻞䠊㻹㼁㻸㼀 㻵 㻙㼁㻺㻵 㼀
㻟䠊㻯㻭㻼㻭㻯 㻵 㼀㼅 㻯㻻㻺㼀㻾㻻㻸
㻠䠊㻿㻯㻴㻱㻰㼁㻸㻱
㻡䠊㻻㻼㻱㻾㻭㼀 㻵㻻㻺 㻰㻭㼀㻭
㻢䠊㻸㻻㻭㻰 㻰㻭㼀㻭
㻣䠊㻭㻸㻭㻾㻹 㻴㻵 㻿㼀㻻㻾㼅
㻤䠊㻿㻴㼁㼀㻰㻻㼃㻺 㻴㻵 㻿㼀㻻㻾㼅
㻿㻱㼀䠖㻻㻼㻱㻺 㻹㻻㻺䠖㻮㻭㻯㻷
㼇㻰㻱㼀㻭㻵 㻸㻿㼉
㻝䠊 㼍㼍㼍㼍㼍㼍㼍㼍㼍㼍㼍㼍㼍
㻰㻵㻿䠊㻼㻾㻱㻿䠖 㻌㻌 㻠㻤㼜㼟㼕
㻵㻺㼀㻿㼀㻳䠊㻼䠖 㻖㻖㼜㼟㼕
㻻㻵㻸 㻼㻾㻱㻿䠖 㻖㻖㼜㼟㼕
㻯㻸㼀䠊㻼㻾㻱㻿䠖 㻖㻖㼜 㼟 㼕
㻰㻵㻿䠊㼀㻱㻹㻼䠊㻝䠖 㻝㻤㻜䉣
㻰㻵㻿䠊㼀㻱㻹㻼䠊㻞䠖 㻝㻤㻜䉣
㻻㻵㻸 㼀㻱㻹㻼䠖 㻖㻖㻖䉣
㻯㻸㼀䠊㼀㻱㻹㻼䠖 㻖㻖 㻖䉣
㻞㻺㻰 㻿㼁㻯㼀䠊㼀䠖 㻖㻖㻖䉣
㻯㼁㻾㻾㻱㻺㼀䠖 㻝㻜㻜㻭
㻹㻻㻺 䠖 㻮㻭㻯㻷
5
Operation Data Display
6
Load Data Display
7
Alarm History
8
Shutdown History
 Loading...