hp calculators
HP 39gs Inference and Hypothesis Testing
hp calculators - 4 - HP 39gs Inference and Hypothesis Testing
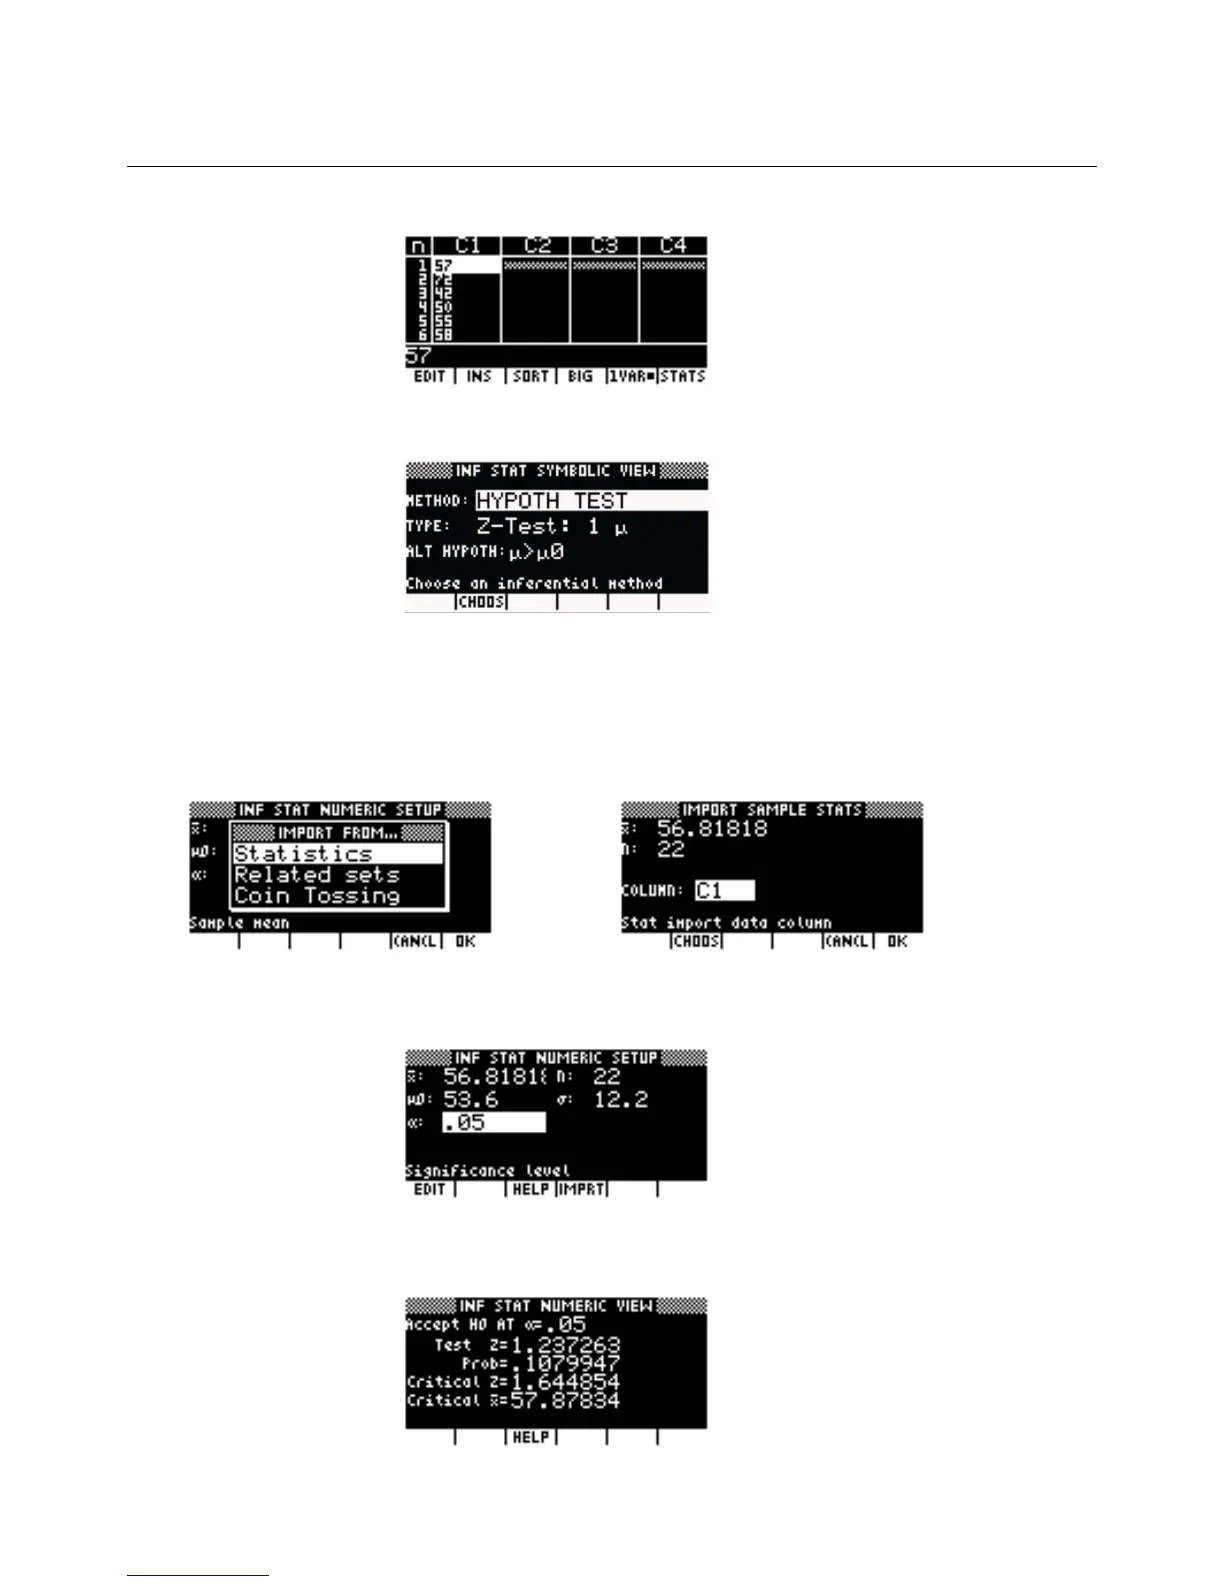
Enter the data into column C1 of the Statistics aplet.
Figure 12
Changing to the Inference aplet, we choose a Hypothesis test using Z-test: 1 Mu, since we know the population standard deviation.
Figure 13
The hypotheses are:
H
0
: The sample is drawn from a population whose mean is the same as the standardized population (Mu=Mu
0
).
H
A
: The sample is drawn from a population whose mean is larger than that of the standardized population (Mu>Mu
0
).
Change to the NUM SETUP view, you can use the import facility to import the summary statistics from the Statistics aplet.
Figure 14 Figure 15
Now enter the values for the mean and standard deviation of the standardized test, and finally enter the significance level of 0.05
(5%).
Figure 16
If we now change to the NUM view we can see that the test z score is less than the required critical z*, and the probability of
obtaining a mean of the value found is 0.1080, which is larger than the required test value of 0.05.
Figure 17