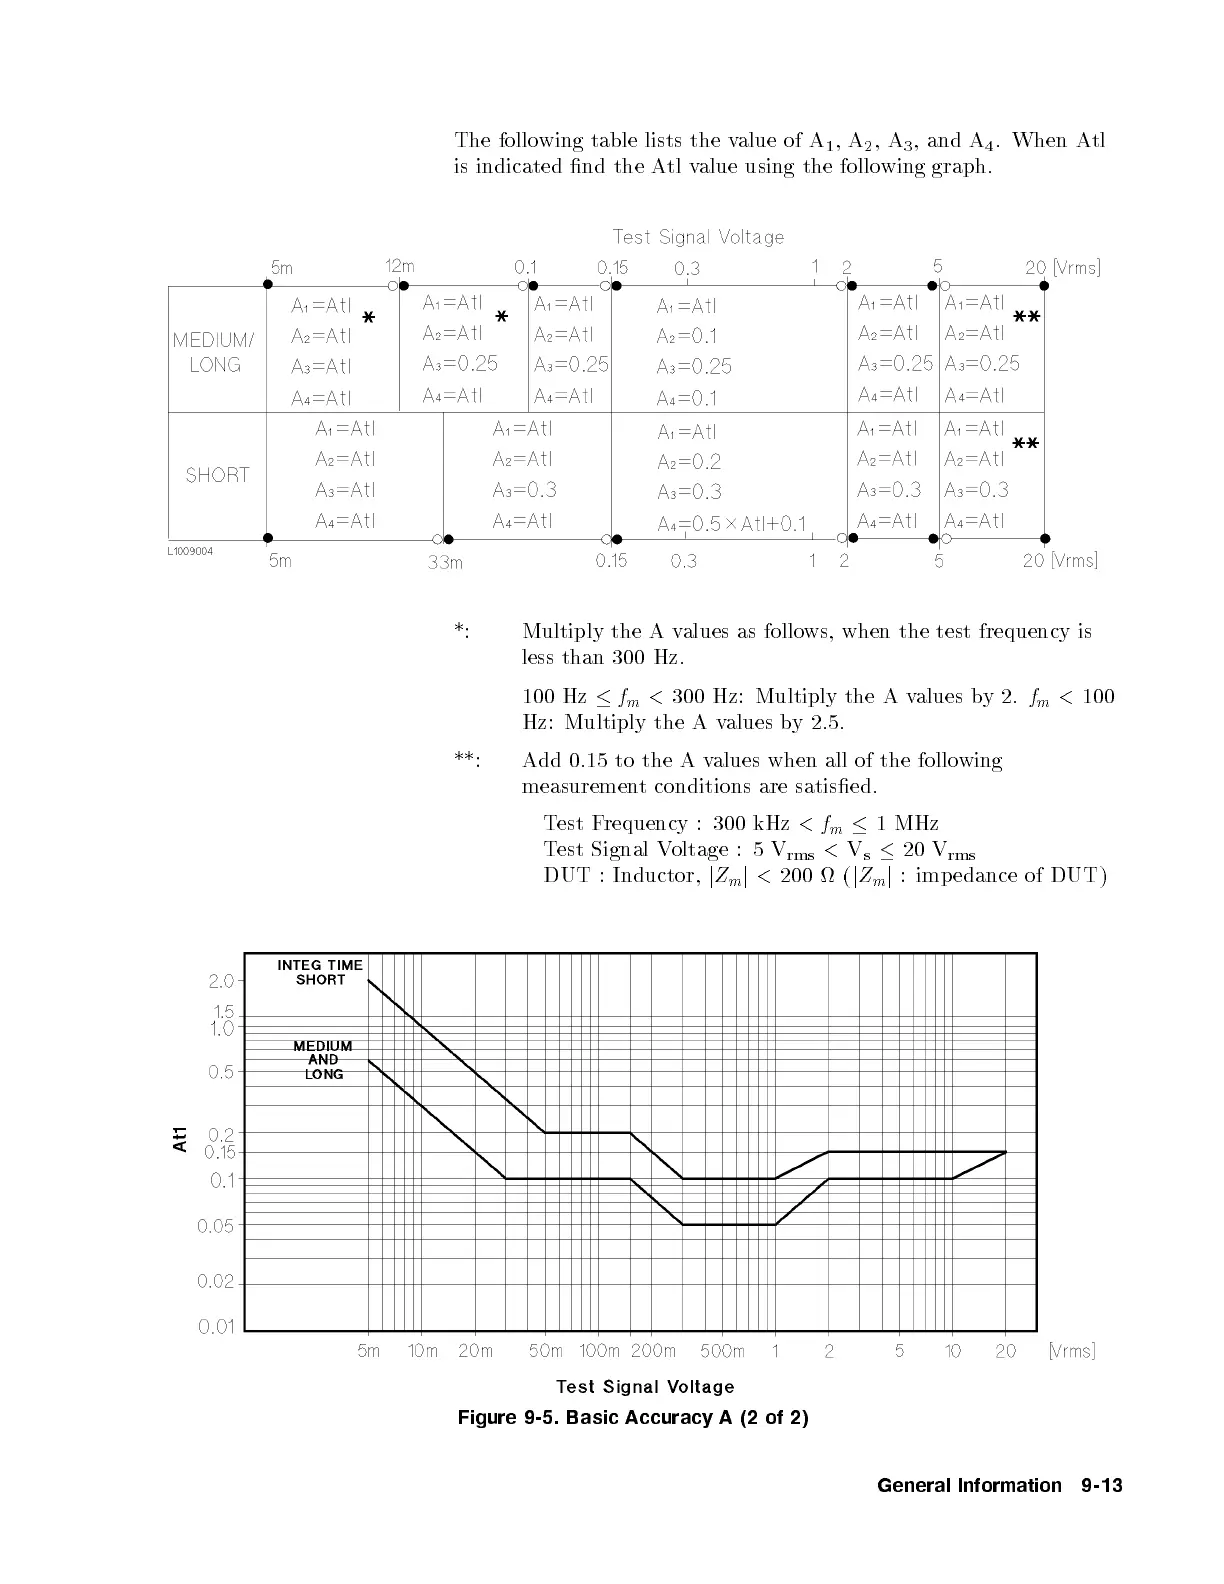
The following table lists the value of A
1
,A
2
,A
3
, and A
4
. When Atl
is indicated nd the Atl value using the following graph.
*: Multiply the A values as follows, when the test frequency is
less than 300 Hz.
100 Hz
f
m
<
300 Hz: Multiply the A values by2.
f
m
<
100
Hz: Multiply the A values by 2.5.
**: Add 0.15 to the A values when all of the following
measurement conditions are satised.
Test Frequency : 300 kHz
<
f
m
1 MHz
Test Signal Voltage : 5 V
rms
<
V
s
20 V
rms
DUT : Inductor,
j
Z
m
j
<
200 (
j
Z
m
j
: imp edance of DUT)
Figure 9-5. Basic Accuracy A (2 of 2)
General Information 9-13


 To Next Page