EasyManuals Logo
Home>HP>Calculator>48gx

HP 48gx User Manual

HP 48gx
116 pages
To Next Page IconTo Next Page
To Previous Page IconTo Previous Page
Page #72 background imageLoading...
Page #72 background image
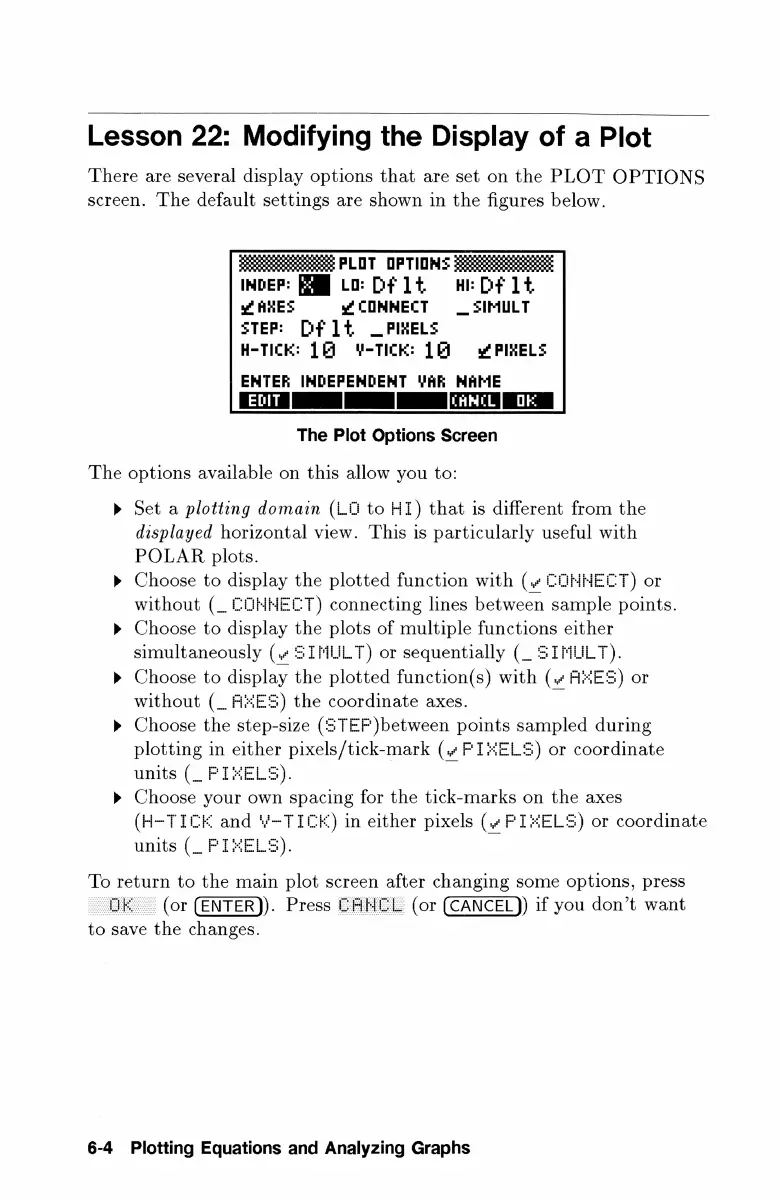
Lesson
22:
Modifying
the
Display
of
a
Plot
There
are
several
display
options
that
are
set
on
the
PLOT
OPTIONS
screen.
The
default
settings
are
shown
in
the
figures
below.
PLOT
OPTIOMZ
inpEP:
Bf]
LO:
DF
11
HEDF
LL
¥
AYES
COMMECT
_
SIMLULT
STEP:
[fF
11
_
PIXELS
H-TICK:
18
Y-TICK:
1@
¢
PIXELS
ENTER
INDEPENDENT
VAR
MAME
ET
|
|
[ANCL]
OK
|
The
Plot
Options
Screen
The
options
available
on
this
allow
you
to:
»
Set
a
plotting
domain
(LU
to
HI)
that
is
different
from
the
displayed
horizontal view.
This
is
particularly
useful
with
POLAR
plots.
»
Choose
to
display
the
plotted
function
with (.
COHHECT)
or
without
(_
COMHECT)
connecting
lines
between
sample
points.
»
Choose
to
display
the
plots
of
multiple
functions
either
simultaneously
SZIMULT)
or
sequentially
(_
SIMULT).
»
Choose
to
display
the
plotted
function(s)
with
(.
FES)
or
without
(_
AXES)
the
coordinate
axes.
B
»
Choose
the
step-size
(STEF)between
points
sampled
during
plotting
in
either
pixels/tick-mark
(.
FI<ELZ)
or
coordinate
units
(_
FIXELE).
»
Choose
your
own
spacing
for
the
tick-marks
on
the
axes
(H=TICE
and
%-TICK)
in
either
pixels
(«+
FIXELE)
or
coordinate
units
(_
FIXELE).
To
return
to
the
main
plot
screen
after
changing
some
options,
press
KE
(or
(ENTER)).
Press
CAMEL
(or
(CANCEL))
if
you
don’t
want
to
save
the
changes.
6-4
Plotting
Equations
and
Analyzing
Graphs

Questions and Answers:

Question and Answer IconNeed help?

Do you have a question about the HP 48gx and is the answer not in the manual?

HP 48gx Specifications

General IconGeneral
BrandHP
Model48gx
CategoryCalculator
LanguageEnglish

Related product manuals