EasyManuals Logo

HP 48gx User Manual

HP 48gx
116 pages
To Next Page IconTo Next Page
To Previous Page IconTo Previous Page
Page #78 background imageLoading...
Page #78 background image
Lesson
25:
Introducing
the
Plot
Types
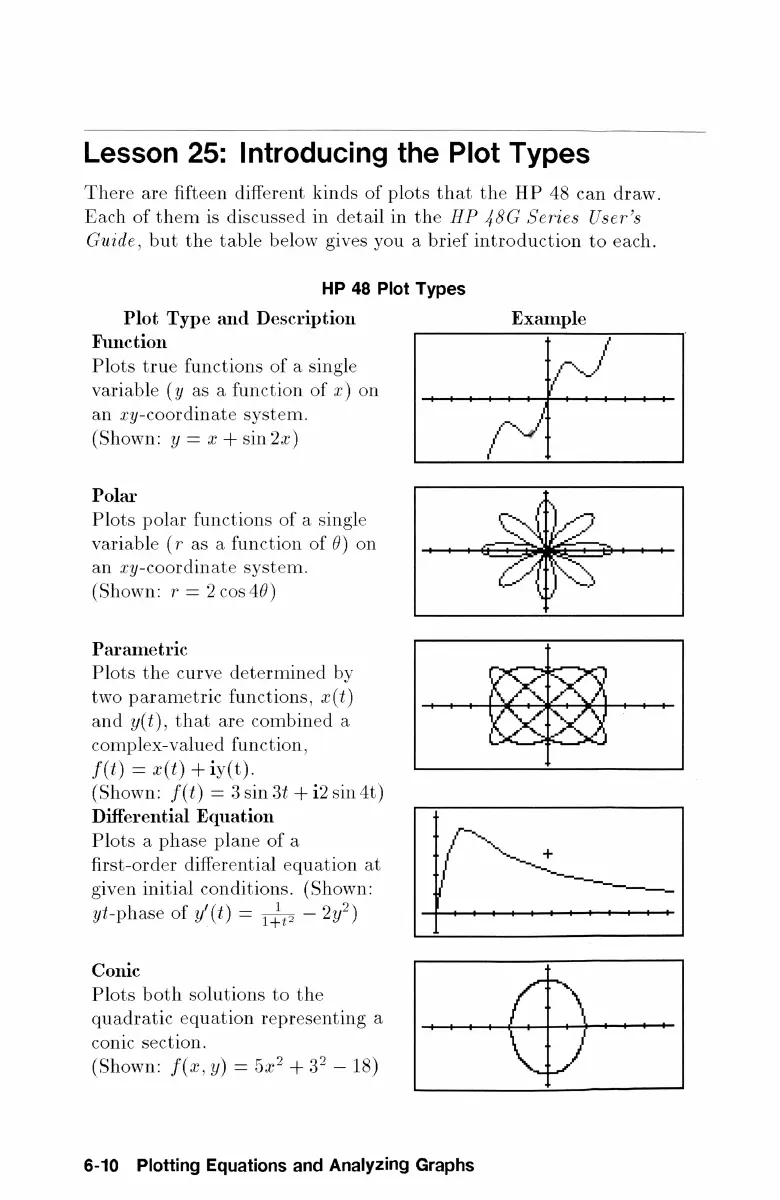
There
are
fifteen
different
kinds
of
plots
that
the
HP
48
can
draw.
Each
of
them
is
discussed
in
detail
in
the
HP
48G
Series User's
Guide,
but
the
table
below
gives
you
a
brief
introduction
to
each.
HP
48
Plot
Types
Plot
Type
and
Description
Example
Function
Plots
true
functions
of
a
single
variable
(y as
a
function
of
z)
on
(Shown:
y
=
x
+
sin
2x)
an
ry-coordinate
system.
1
Polar
Plots
polar
functions
of
a
single
variable
(7 as
a
function
of
)
on
an
ry-coordinate
system.
(Shown:
r
=
2
cos
40)
Parametric
Plots
the
curve
determined
by
two
parametric
functions,
x(?)
and
y(t),
that
are
combined
a
complex-valued
function,
F(t)
=
a(t)
+iv(t).
(Shown:
f(t)
=
3sin3t
+12sin4t)
Differential
Equation
Plots
a
phase
plane
of
a
first-order
differential
equation
at
given
initial
conditions.
(Shown:
yt-phase
of
y(t)
=
The
2%)
Conic
Plots
both
solutions
to
the
quadratic
equation
representing
a
conic
section.
(Shown:
f(x,y)
=
52%
+
3%
18)
any
Nw,
6-10
Plotting
Equations
and
Analyzing
Graphs

Questions and Answers:

Question and Answer IconNeed help?

Do you have a question about the HP 48gx and is the answer not in the manual?

HP 48gx Specifications

General IconGeneral
ModelHP 48gx
TypeGraphing Calculator
Display TypeLCD
Display Size131x64 pixels
Memory128 KB RAM
Expandable MemoryYes, via expansion cards
Release Year1993
ProcessorSaturn
Programming LanguageRPL
Power Supply3x AAA batteries
Weight255 g (9 ounces)

Related product manuals