EasyManua.ls Logo

HP HP-20S - Page 60

HP HP-20S
132 pages
To Next Page IconTo Next Page
To Previous Page IconTo Previous Page
Loading...
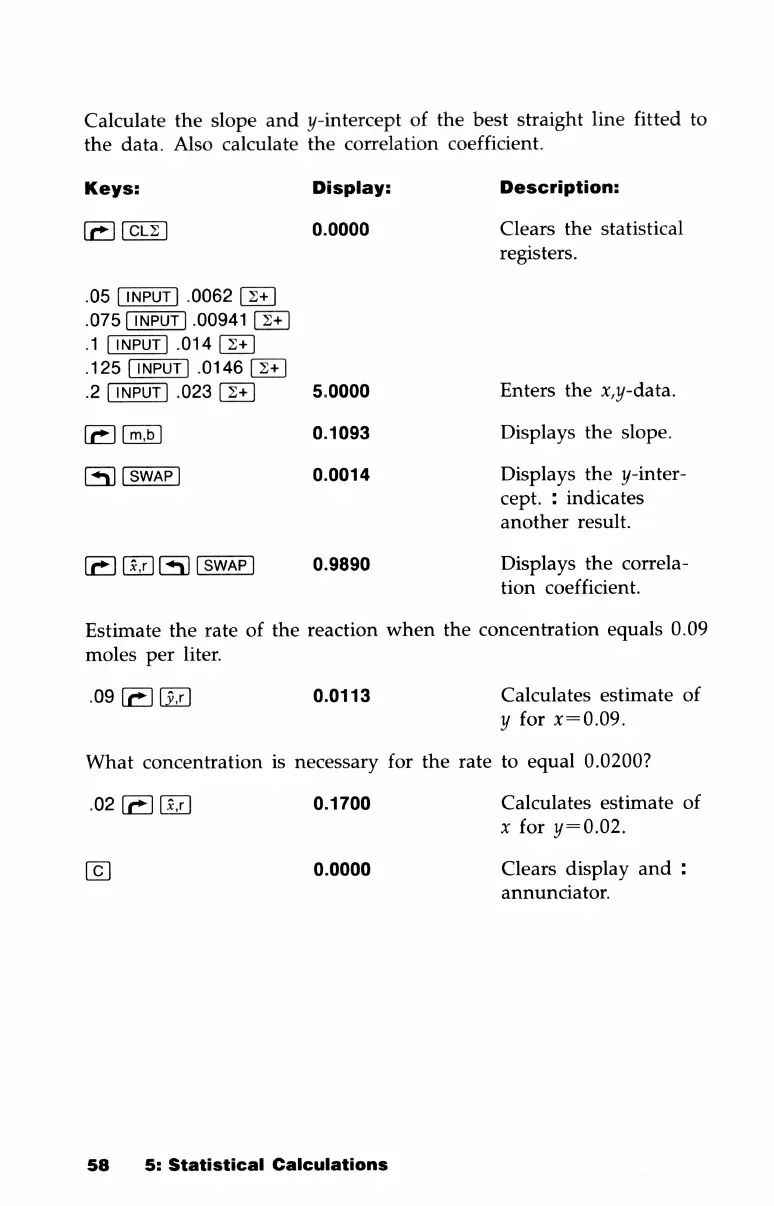
Calculate
the
slope
and
y-intercept
of
the
best
straight
line
fitted
to
the
data.
Also
calculate
the
correlation
coefficient.
Keys:
Display:
Description:
N
0.0000
Clears
the
statistical
registers.
.05
.0062
075
00941
R
014
125
0146
2
.023
5.0000
Enters
the
x,y-data.
()
0.1093
Displays
the
slope.
(]
0.0014
Displays
the
y-inter-
cept.
:
indicates
another
result.
()
Grl(=)
0.9890
Displays
the
correla-
tion
coefficient.
Estimate
the
rate
of
the
reaction
when
the
concentration
equals
0.09
moles
per
liter.
.09
(]
0.0113
Calculates
estimate
of
y
for
x=0.09.
What
concentration
is
necessary
for
the
rate
to
equal
0.0200?
.02
(]
0.1700
Calculates
estimate
of
x
for
y=0.02.
0.0000
Clears
display
and
:
annunciator.
58
5:
Statistical
Calculations

Table of Contents

Related product manuals