26
27
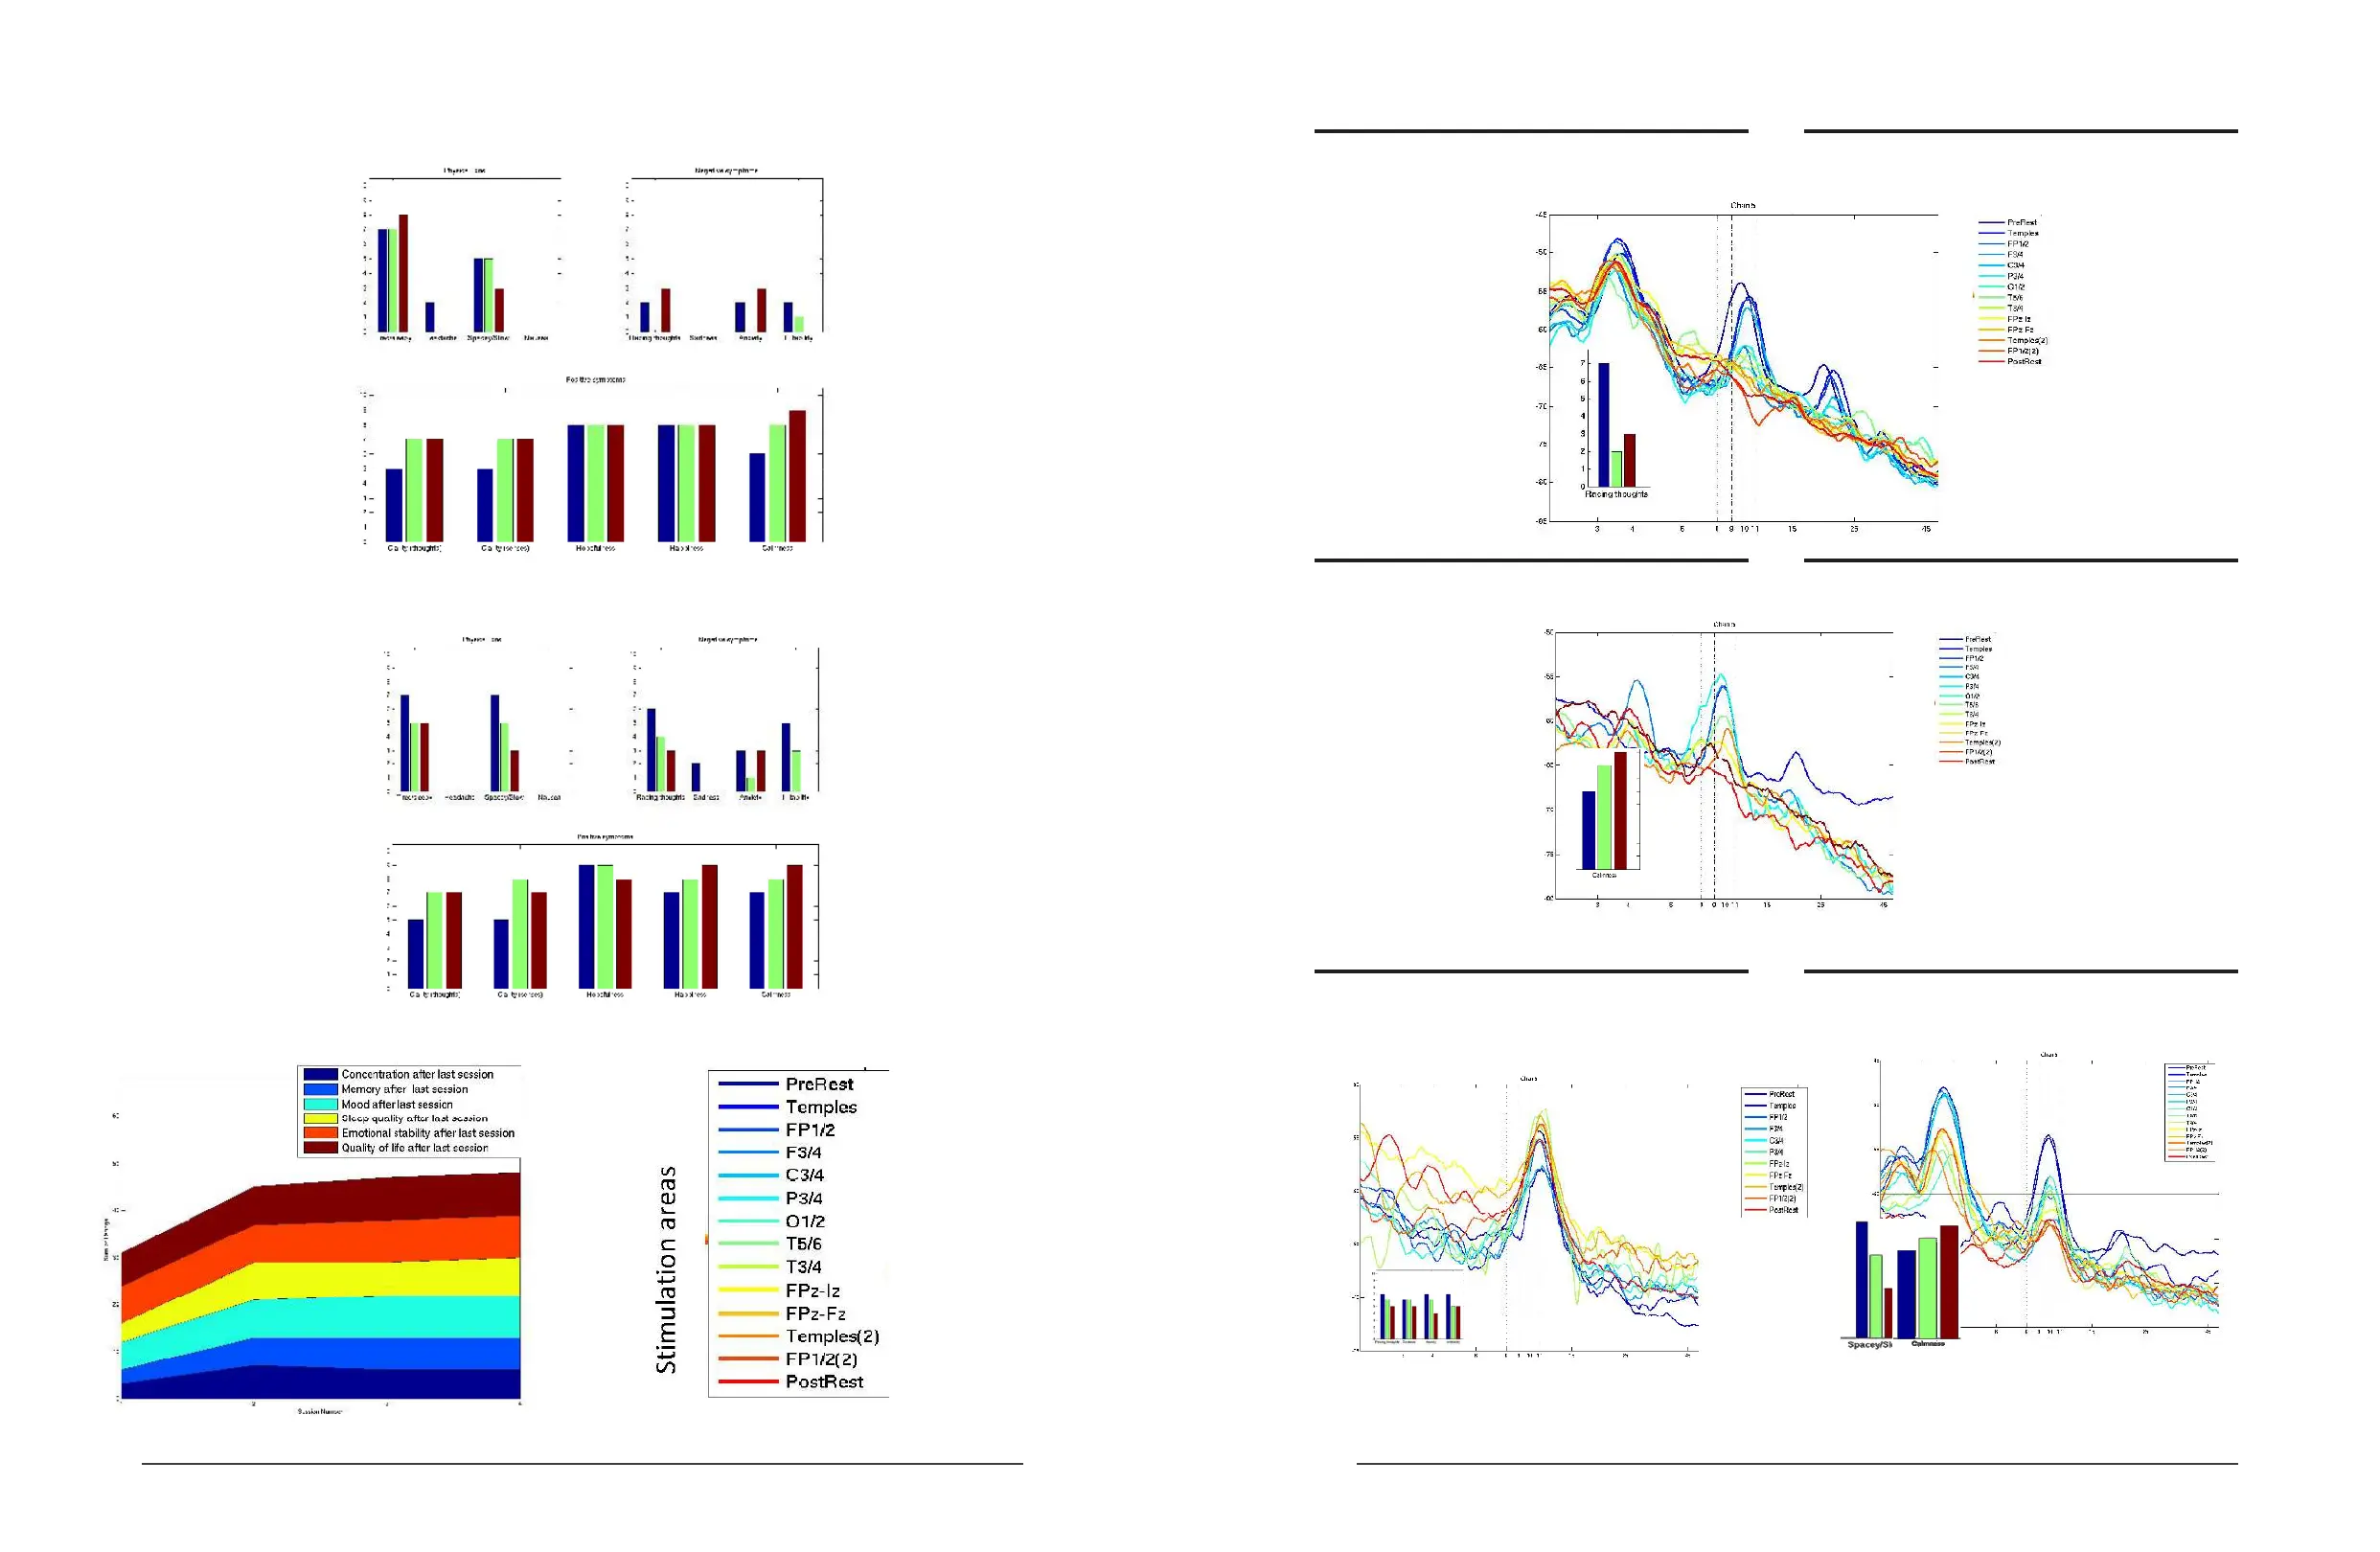
Subject 1, Session 2
Subject 1, Session 3
Subject 1 Life quality changes across sessions
Figure legend explanation
Colored lines on the following slides refer to dierent
locations of the stimulation electrodes.
e progression from Blue to Red is also a progres-
sion over time during the session, in addition to
representing dierent stimulation locations.
Pre and Post rest had no stimulation
Subject 1, Session 2
Left occipital channel
~9.75 Hz
alpha to
start
Decreasing
alpha power,
increasing
alpha frequency
over the session
(technical issues
prevented further
recordings during
this session
Frequency (Hz)
Power (dB)
Stimulation areas
Subject 1, Session 3 Left occipital channel
Healthy
~10 Hz
alpha to
start
Alpha frequency
already healthy,
but alpha power
still decreases
over the session.
Frequency (Hz)
Power (dB)
Stimulation areas
Subject 2, Session 1 Left occipital channel
Already
high (11Hz)
alpha
Alpha frequency
already healthy,
but alpha power
decreases over
the session.
Frequency (Hz)
Power (dB)
Subject 1, Session 1
Left occipital channel
~9.5 Hz
alpha to
start
Decreasing
alpha power,
increasing
alpha frequency
over the session
Power (dB)
Stimulation areas
Frequency (Hz)
 Loading...