User Manual
May 2018 910.00382.0001
43
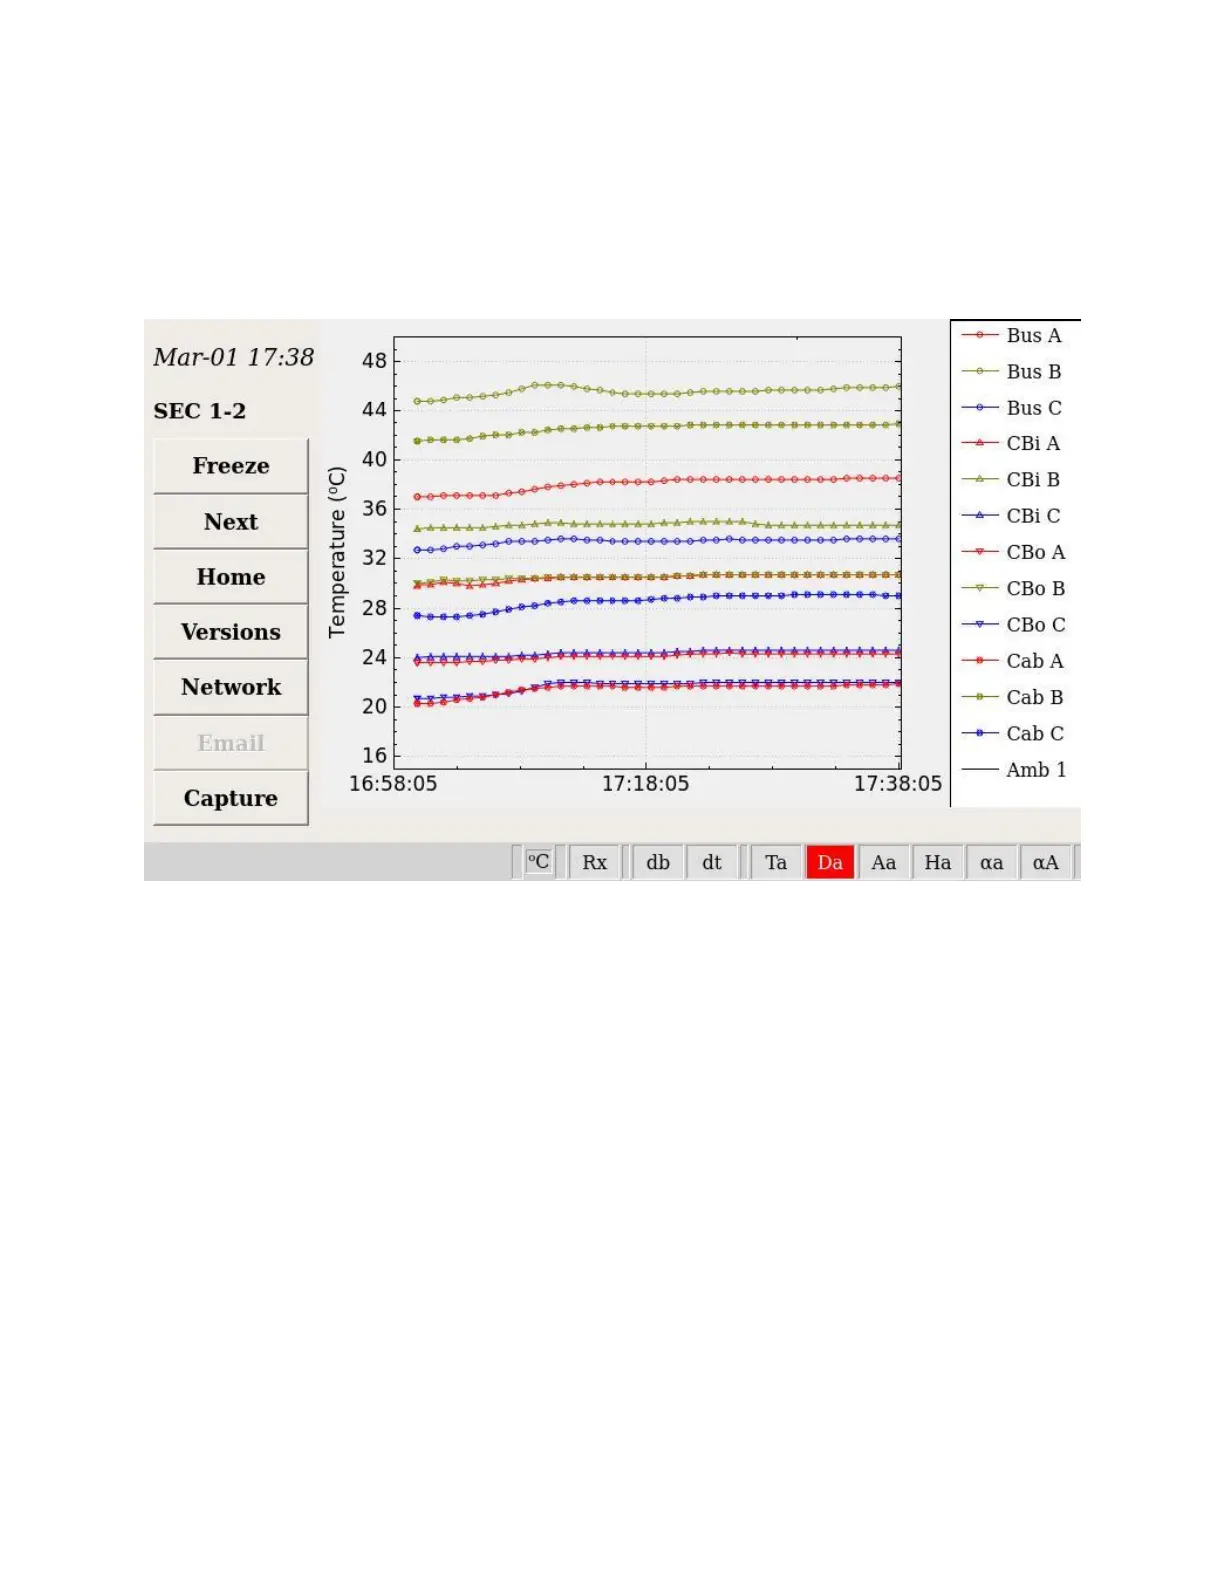
4.2.2.2 Graphical Data Screen
The temperature sensor data can also be displayed as a graphical trend. The legend shows all available
sensors (up to 12) and 1 ambient temperature sensor. The graph only displays data for enabled registers
in the Home Screen.
Figure 26: Temperature Graphical Display Example
Notes:
➢ Ambient Temperature is pulled from the first connected Humidity Sensor to a device
➢ Legend labels cannot be modified through the CAM Display Tool.
 Loading...