28
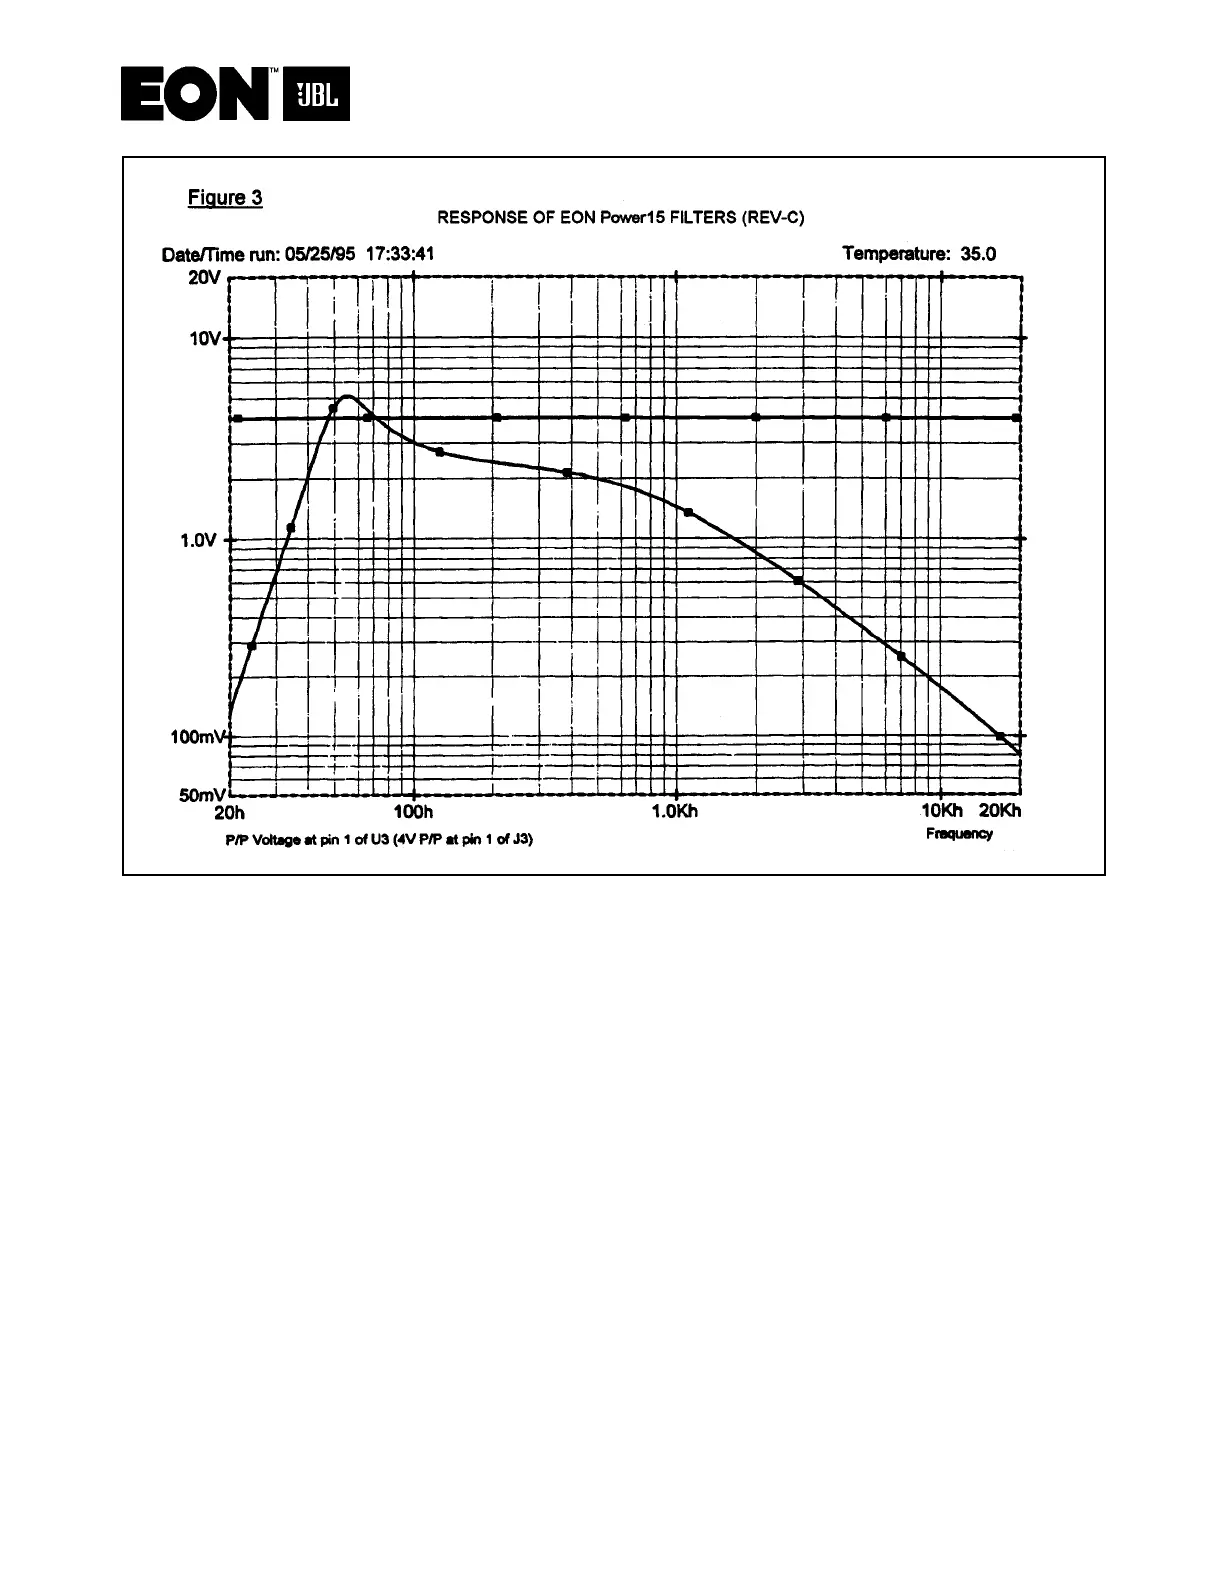
Measure the response at pin 1 of U3. Note in figure 3 above that the input voltage has not
been changed. (Voltage at pin 1 of J3). The other curve represents the response at the
output of the third section of the filter.
The third section is a low Q (Q equals about .7) high-pass filter at 33Hz.
Verify the peak frequency, 55Hz and the peak voltage 5.1V P/P. Also verify voltages at
20Hz, 30Hz, and 40Hz.
If the response is incorrect check values of C29, C30, C34, R56 and R57.
After obtaining proper response proceed to following section.