8 Operation
118
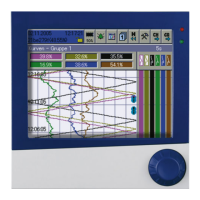
8.6.1 Data monitor/recording function control elements
(1) 3-channel binary channel diagram (visualization of the recorded
signal states of up to 3 binary values)
(2) "Next Channel" button for scrolling through the stylus trace views (graph-
ical representations of a scale with a stylus) for the individual
Channels 1 to 4
⇨ "Stylus trace view", page 119
(3) Only with the recording extra code:
"History" button for viewing all saved measurement data and events
The user must be logged in with corresponding user rights to display the
"History" button.
⇨ Chapter 8.2.1 "Log-on/Log-out", page 89
(4) 4-channel line recorder diagram
(visualization of the recorded measurement data from up to 4 analog
channels and display of events as icons)
(5) Field for displaying the numerical value of the current measuring values
from the
Analog channels 1 to 4

 Loading...