7
Figures
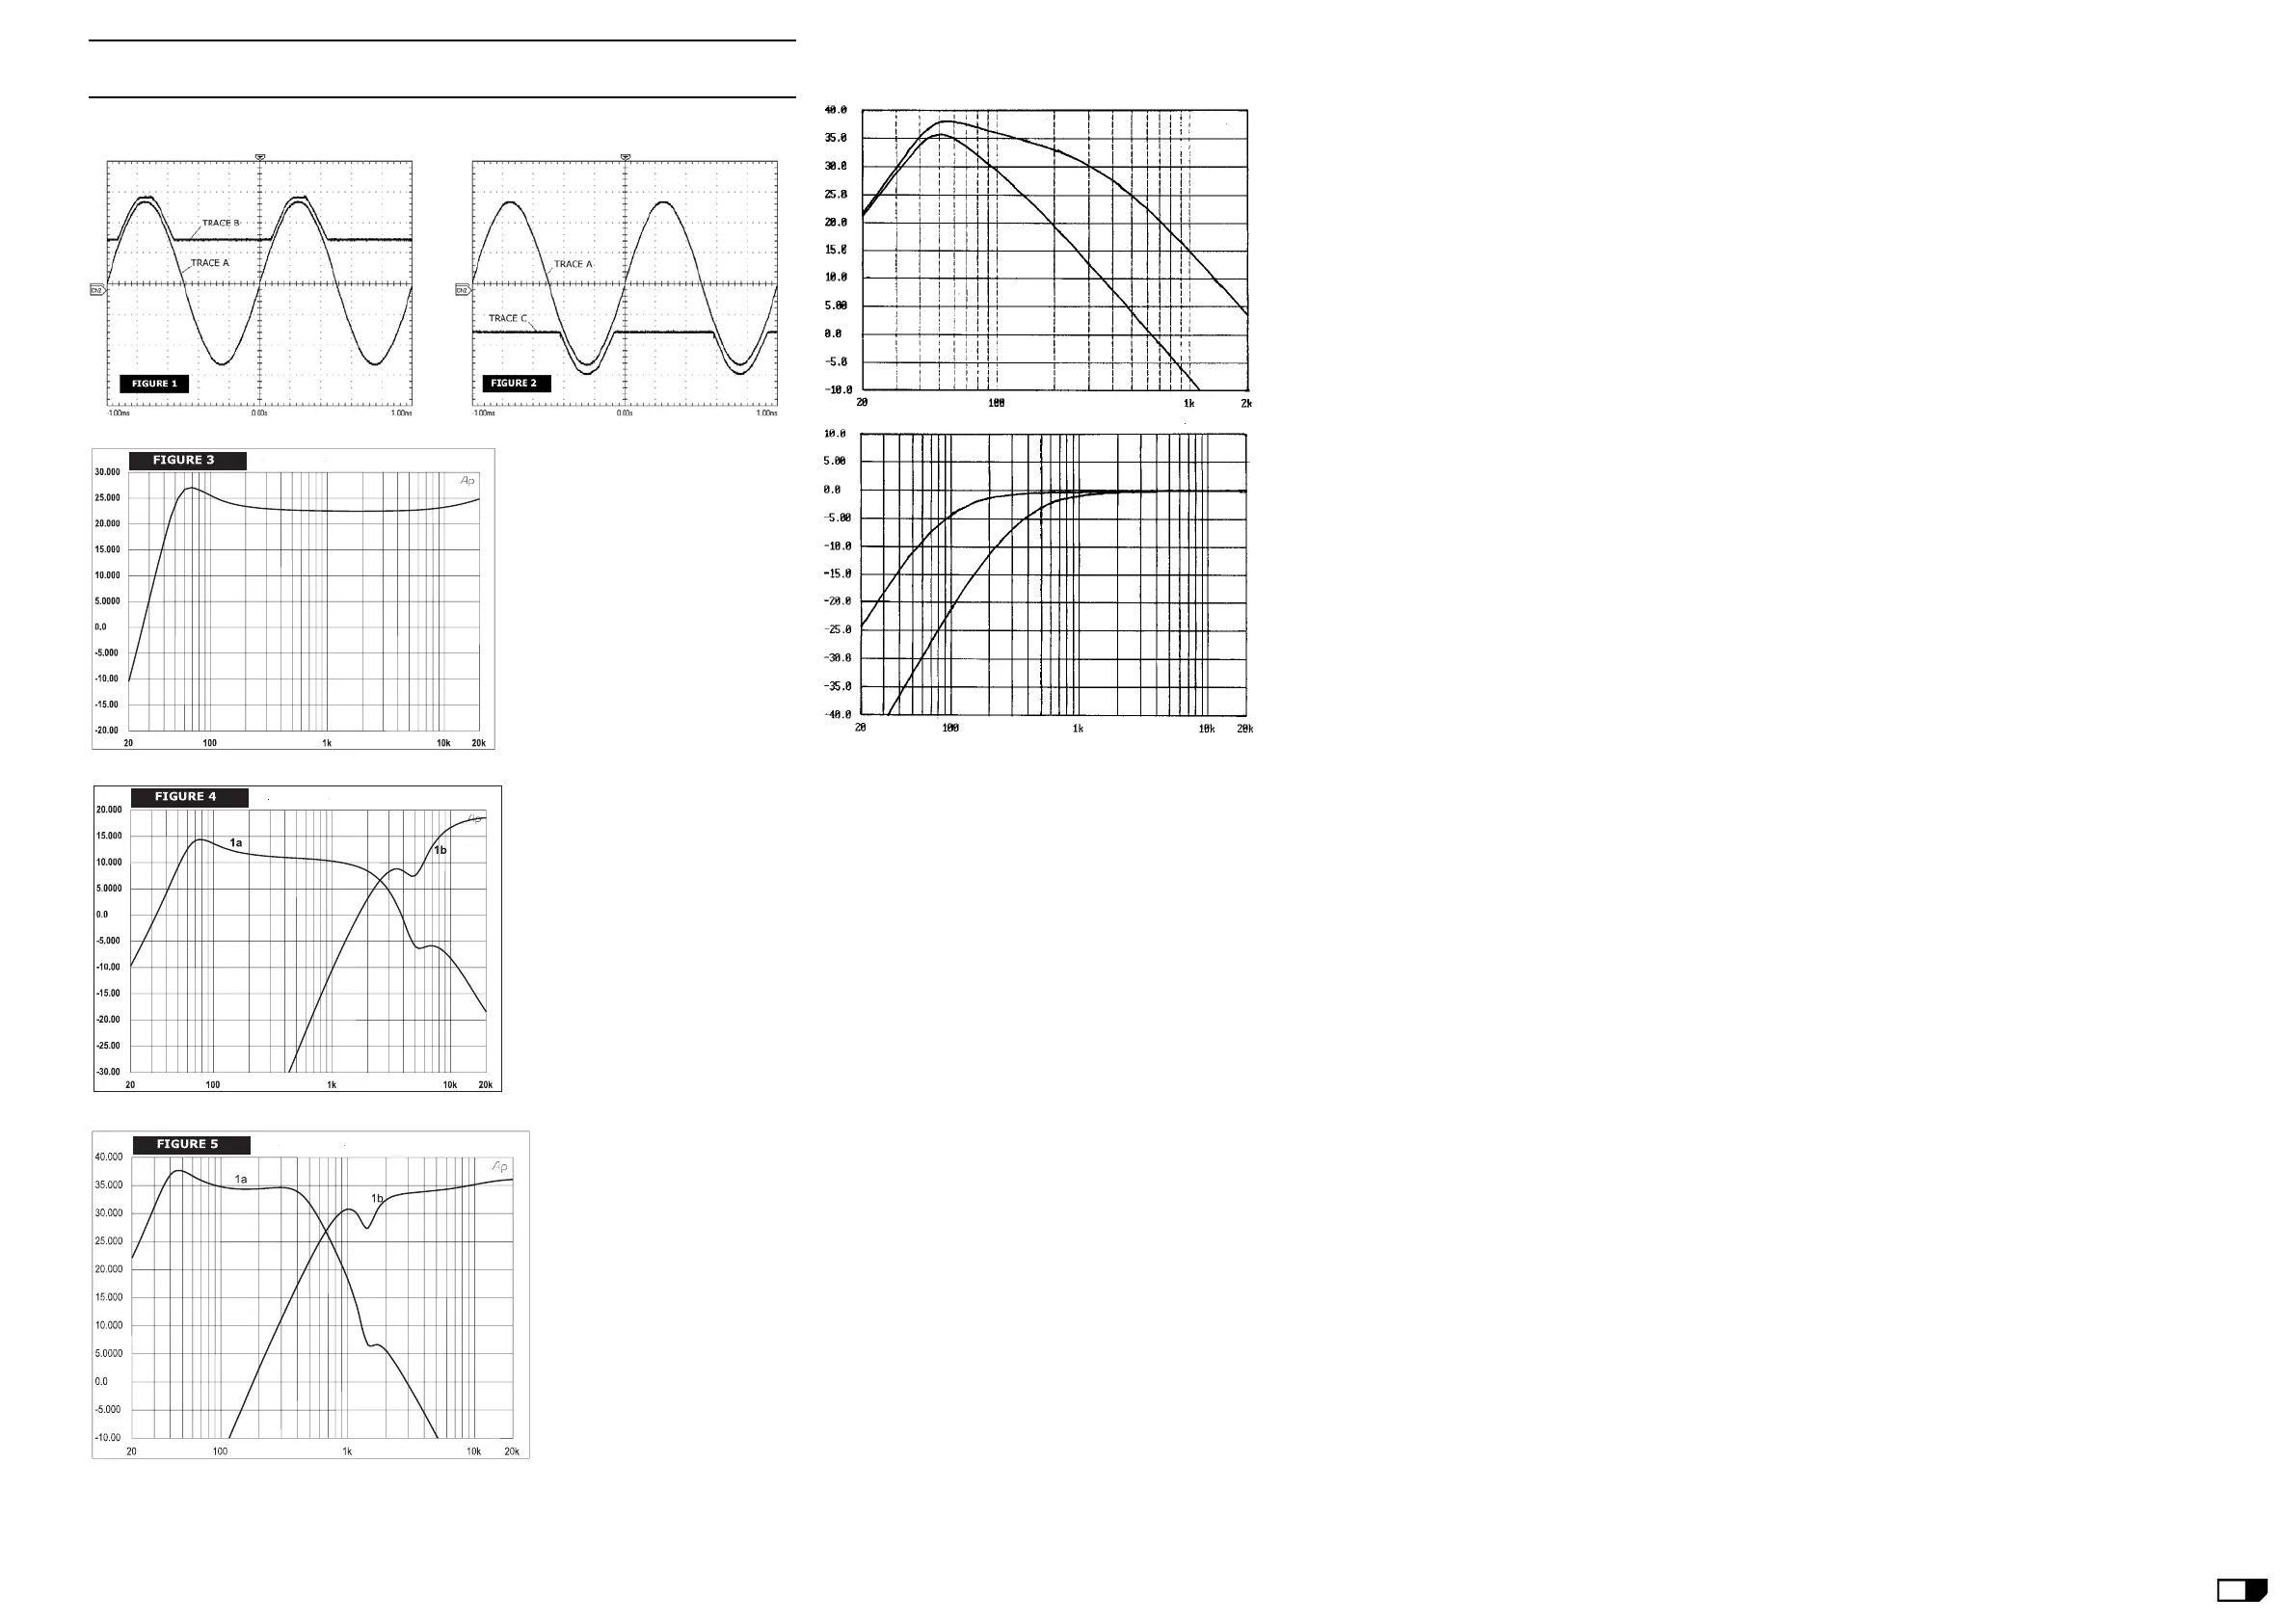
Figure 1 and 2 show the right shape of the traces but not their real levels, refer to the levels
mentioned in the chapter of appropriate amplifi ed loudspeaker.
Figure 3 shows the frequency response of the H150A-H200A AMPLIFIER.
Figure 4 shows the frequency response of the H300A DUAL AMPLIFIER.
Figure 5 shows the frequency response of the H350A DUAL AMPLIFIER.
Figure 6 & 7 show the H350SA & H400SA amplifi er response and sat out response, the
crossover frequency is sweepable into 80-300Hz range.



 To Next Page