MAN B&W 2.10
Page 2 of 2
MAN Diesel
MAN B&W S65ME-C8.2/-GI-TII 198 84 18-5.0
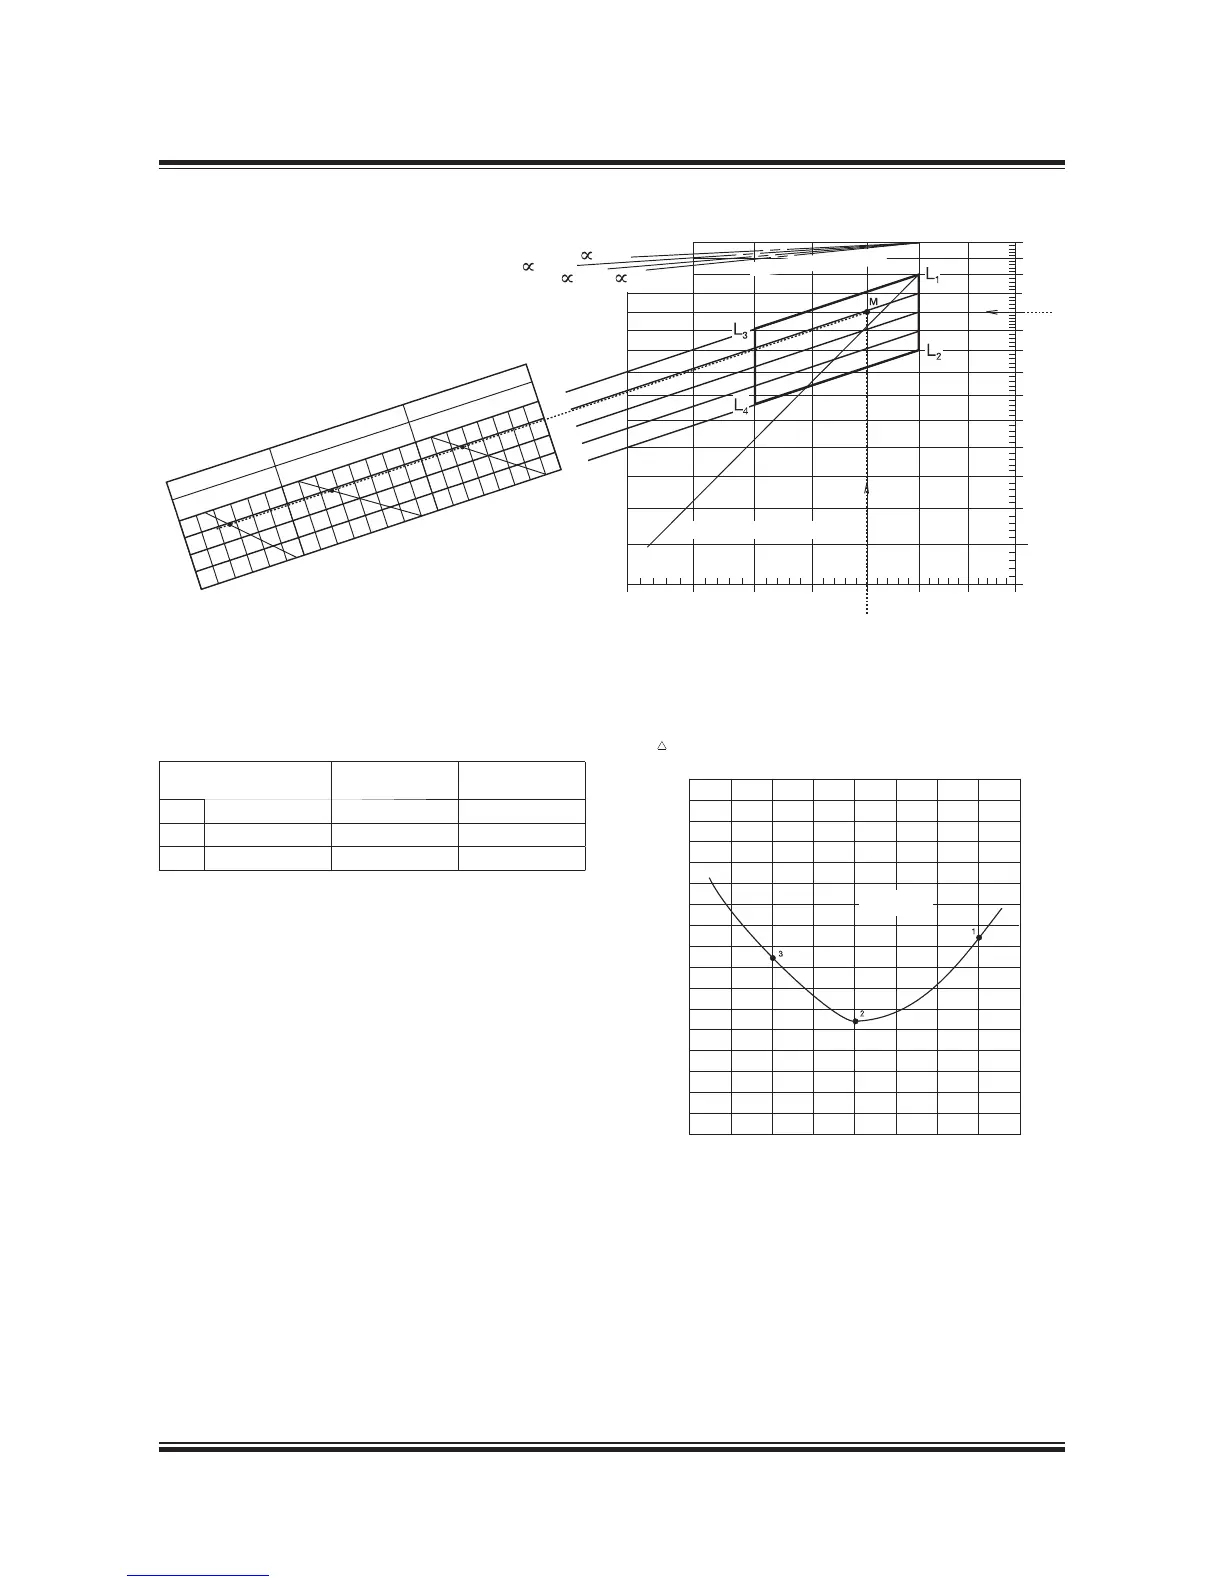
Fig. 2.10.01: Example of SFOC for derated 6S65ME-C8.2/-GI with fixed pitch propeller and high efficiency
turbocharger
40% 50% 60% 70% 80% 90% 100% 110%
Nominal SFOC
Diagram a
Part Load SFOC curve
30%
% of SMCR
SFOC
g/kWh
+1
+2
+3
+4
+5
+6
0
1
2
3
4
5
6
7
8
9
10
11
g/kWh
SFOC
165
160
170
175
169
50% SMCR
70% SMCR
100% SMCR
1 2 3 4 5
4 5 6 7 8 9 10
0 1 2 3 4 5 6
mep
100%
95%
85%
80%
90%
Constant ship speed lines
105%
40%
50%
60%
70%
80%
90%
100%
Power, % of L
1
Speed, % of L
1
75% 80% 85% 90% 95% 100%
Nominal propeller curve
=0.15
=0.25
=0.20
=0.30
Diagram b
Reduction of SFOC in g/kWh relative to the nominal in L
1
90%
95%
178 63 09-0.0
178 63 23-2.0
The reductions, see diagram b, in g/kWh compared to
SFOC in L
1
:
Part load points
SFOC
g/kWh
SFOC
g/kWh
1 100% M -1.6 167.4
2 70% M -5.6 163.4
3 50% M -2.6 166.4
 Loading...