46
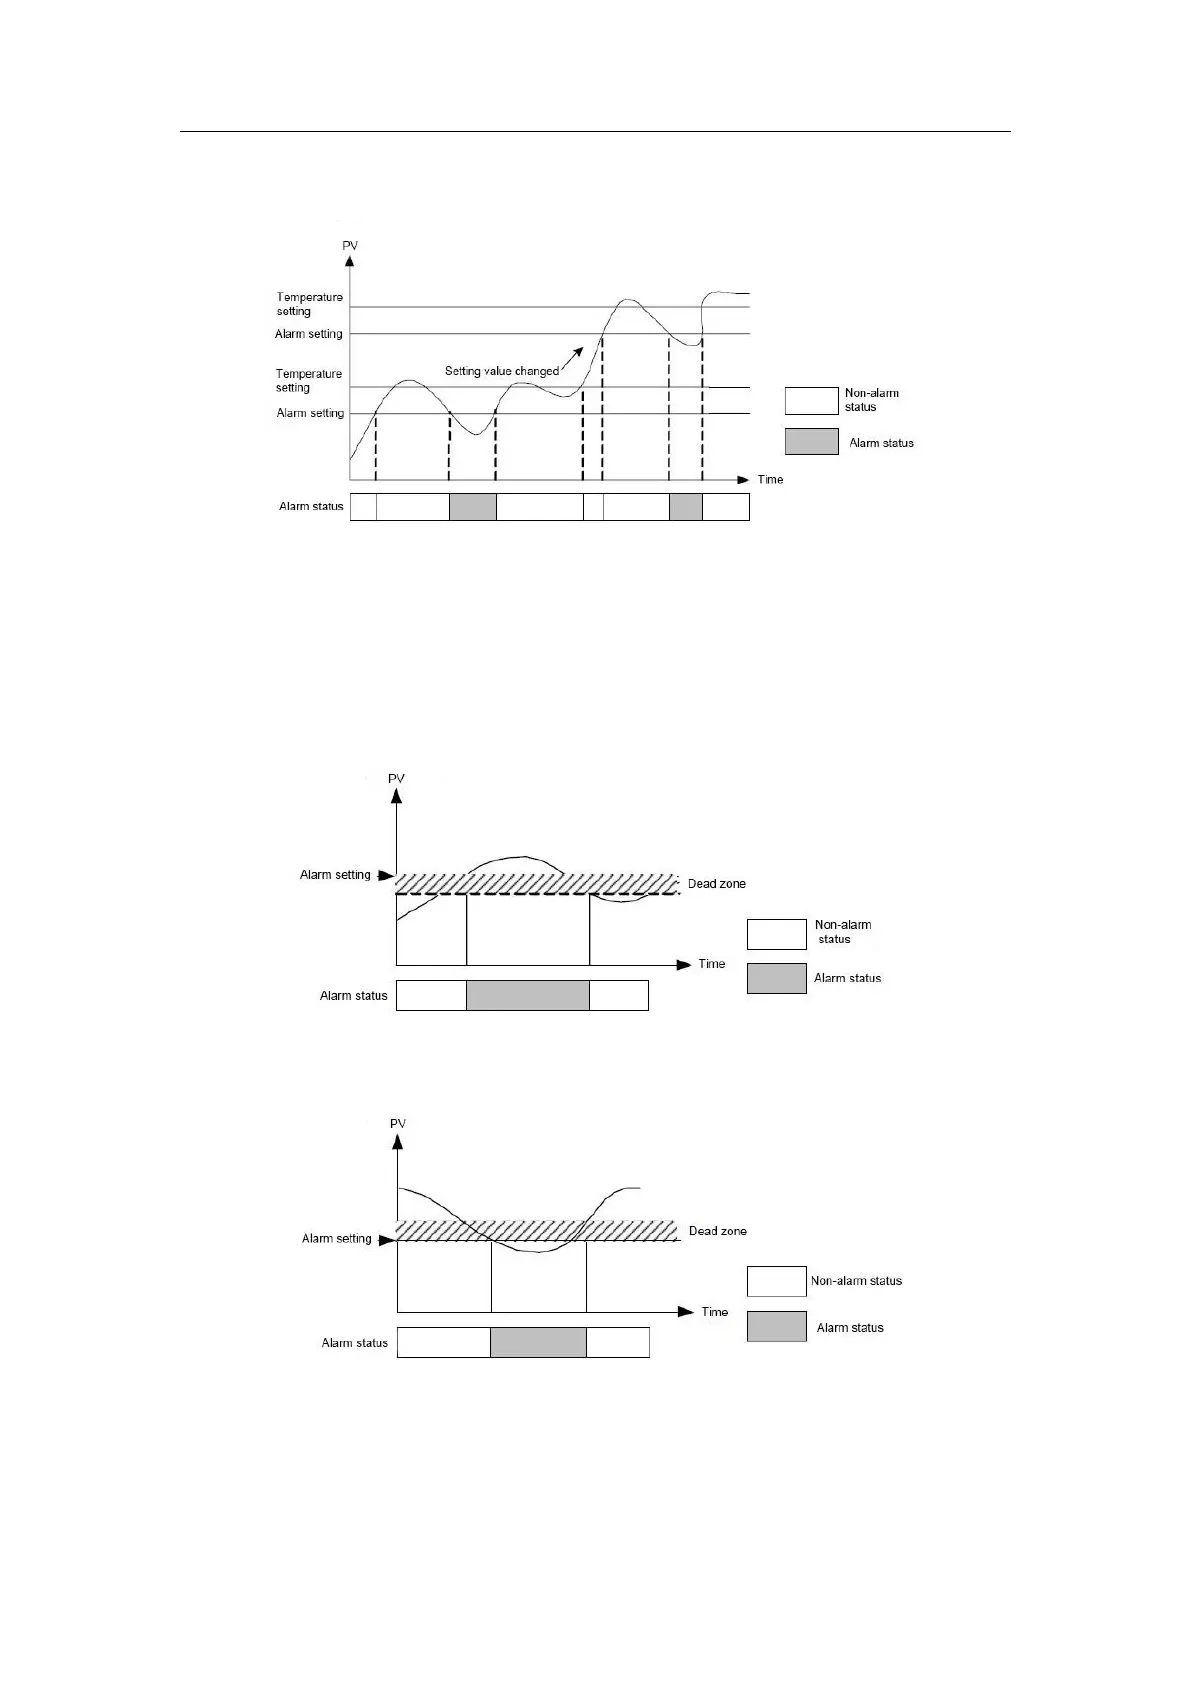
alarm triggered by the measured value when the set value is changed (waiting), until the measured
value next triggers the alarm, as shown in figure 5-16.
Figure 5-16 Schematic diagram of the wait again the alarm
5.3.2 Alarm dead zone
In order to avoid repeated occurrence of the alarm state and non-alarm state when the
measured value fluctuates around the alarm setting value, the alarm dead zone (BFM # 604) can
be set. The alarm dead zone applies to all alarm types and all channels. See Figure5-17 ~ Figure
5-19.
Figure 5-17 Schematic diagram of high limit and deviation high
Figure 5-18 Schematic diagram of low limit and deviation low
 Loading...