IMPACT ECHO (IE)
www.olsoninstruments.com www.olsonengineering.com
Impact-Echo Scanner
The Impact-Echo rolling Scanner was first conceived by the second author of this paper and subsequently
researched and developed as a part of a US Bureau of Reclamation prestressed concrete cylinder pipe
integrity research project (6). This technique is based on the Impact-Echo method (5 and 7). In general,
the purpose of the Impact-Echo test is usually to either locate delaminations, honeycombing or cracks
parallel to the surface or to measure the thickness of concrete structures with typically one-sided access
for testing (pavements, floors, retaining walls, tunnel linings, buried pipes, etc.). To expedite the Impact-
Echo testing process, an Impact-Echo scanning device has been developed with a rolling transducer
assembly incorporating multiple sensors, attached underneath the test unit. When the test unit is rolled
across the testing surface, an opto-coupler on the central wheel keeps track of the distance. This unit is
calibrated to impact and record data at intervals of nominally 25 mm (1 inch). If the concrete surface is
smooth, a coupling agent between the rolling transducer and test specimen is not required. However, if
the concrete surface is somewhat rough, water can be used as a couplant to attempt to improve
displacement transducer contact conditions. The maximum frequency of excitation of the impactor in the
scanner used in research is 25 kHz. The impactor in scanner can be replaced for an impactor that
generates higher frequency.
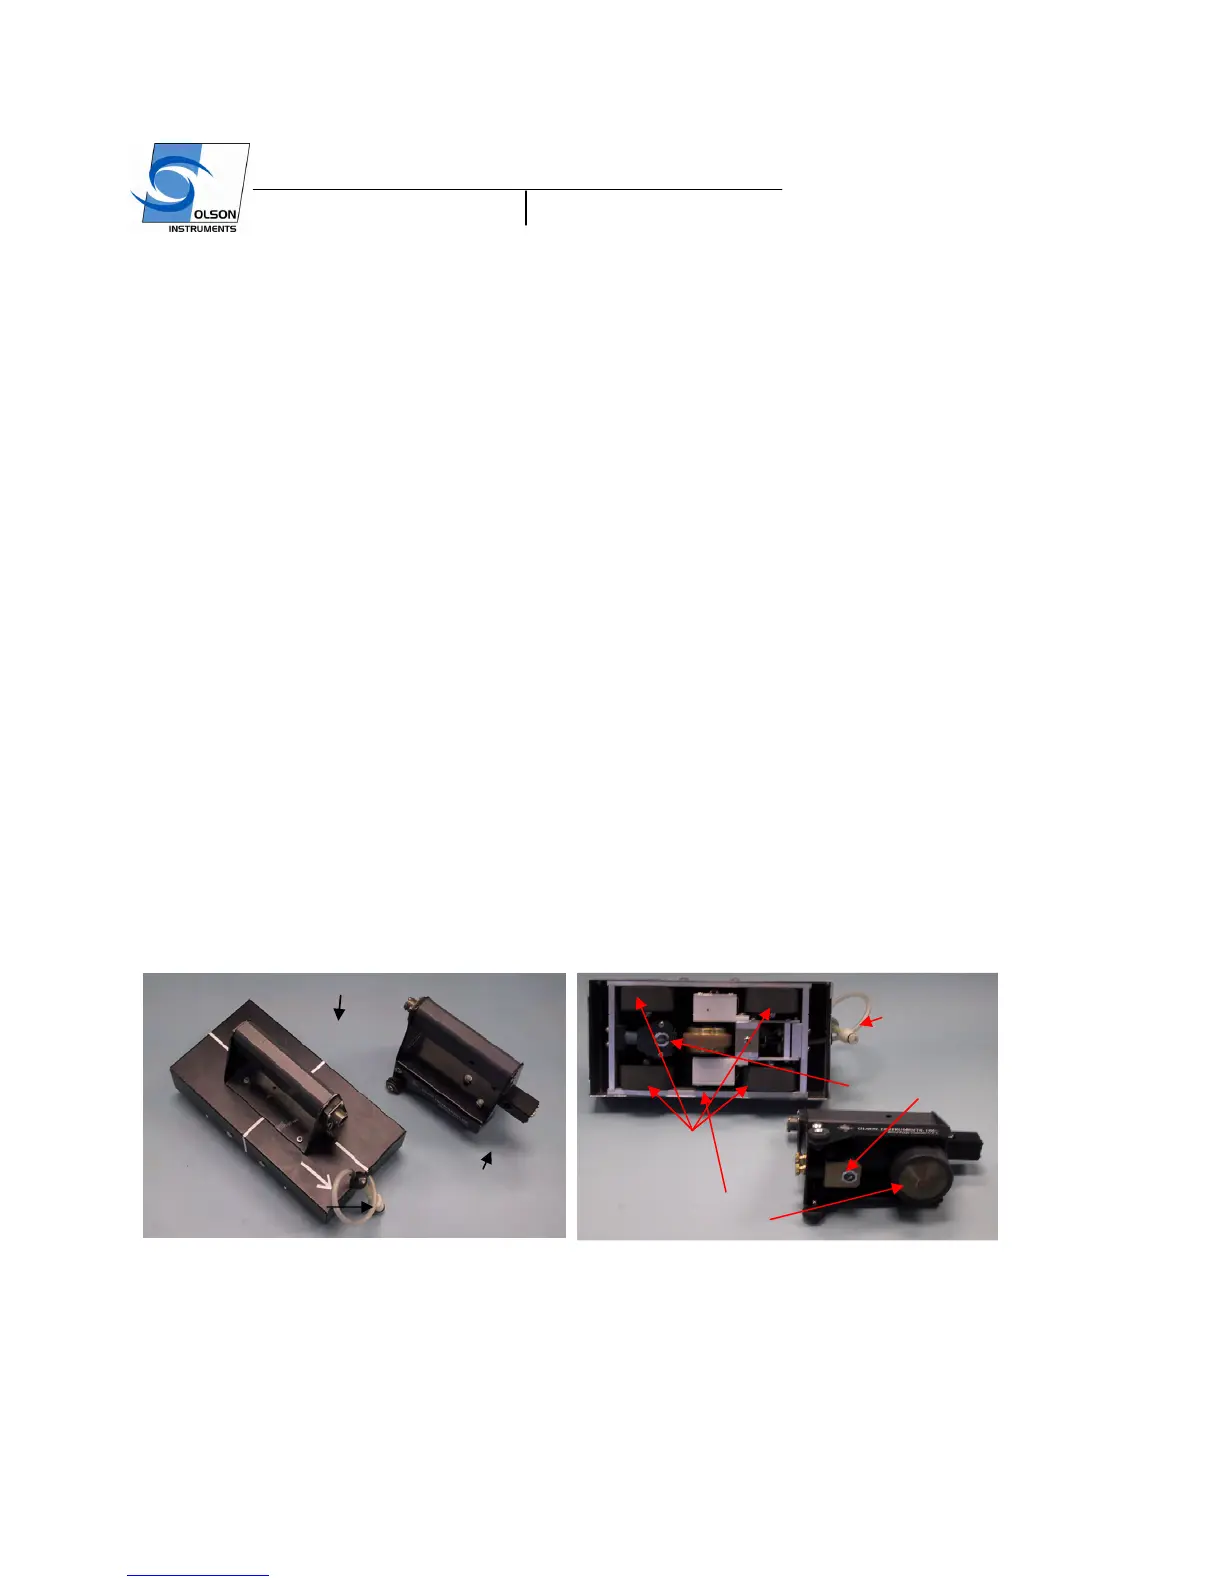
A comparison of the Impact-Echo Scanner and the point by point Impact-
Echo Scanner unit is shown in Figure 1. Typical scanning time for a line of 4 m (13 ft), approximately
160 test points, is 60 seconds. In an Impact-Echo scanning line, the resolution of the scanning is about 25
mm (1 inch) between IE test points. Data analysis and visualization was achieved using Impact-Echo
scanning software developed by the first author for this research project. Raw data in the frequency
domain were first digitally filtered using a Butterworth filter with a band-pass range of 2 kHz to 20 kHz.
Due to some rolling noise generated by the Impact-Echo Scanner, a band-stop filter was also used to
remove undesired rolling noise frequency energy. Automatic and manual picks of dominant frequency
were performed on each spectrum and an Impact-Echo thickness was calculated based on the selected
dominant frequency. A three-dimensional plot of the condition of the tested specimens was generated by
combining the calculated Impact-Echo thicknesses from each scanning line. The three-dimensional
results can be presented in either color or grayscale.
Figure 1 – Impact-Echo Scanner Unit and Point-by-Point Impact-Echo Unit
GENERAL DESCRIPTION OF THE SPECIMENS AND DEFECTS
Two mockup specimens were used in the study. The first specimen is a full scale pre-cast girder with
eight steel ducts inside. The second specimen is a mockup slab located at the BAM facility in Berlin,
Impact-Echo
Scanner
Point-by-point IE-1
tube to provide
water for
tube to provide
water for
Rolling transducer
Displacement transducer
automatic
impactors
wheels
 Loading...