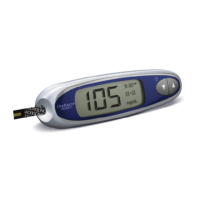
105
6
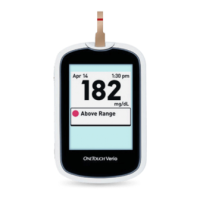
Summary, Results Log and Trend 90
The current 90-day average will be displayed as a blood
glucose value with the unit of measure. Each point on
the graph represents a 90-day average automatically
generated every 14 days. You can track your Trend 90
visually by following the path of points along the graph.
Example
Trend 90
15.2
5.8
8.9
mmol/L
Current
Avg.
3
4
1
2
2. Press to return to the Main Menu
1 Current 90-day average
2 Newest average point
3 90 Day Average Target set in
the meter
4 Oldest average point
 Loading...