3.130
9928487 R01 - 2018 RANGER XP 1000 Service Manual
© Copyright Polaris Industries Inc.
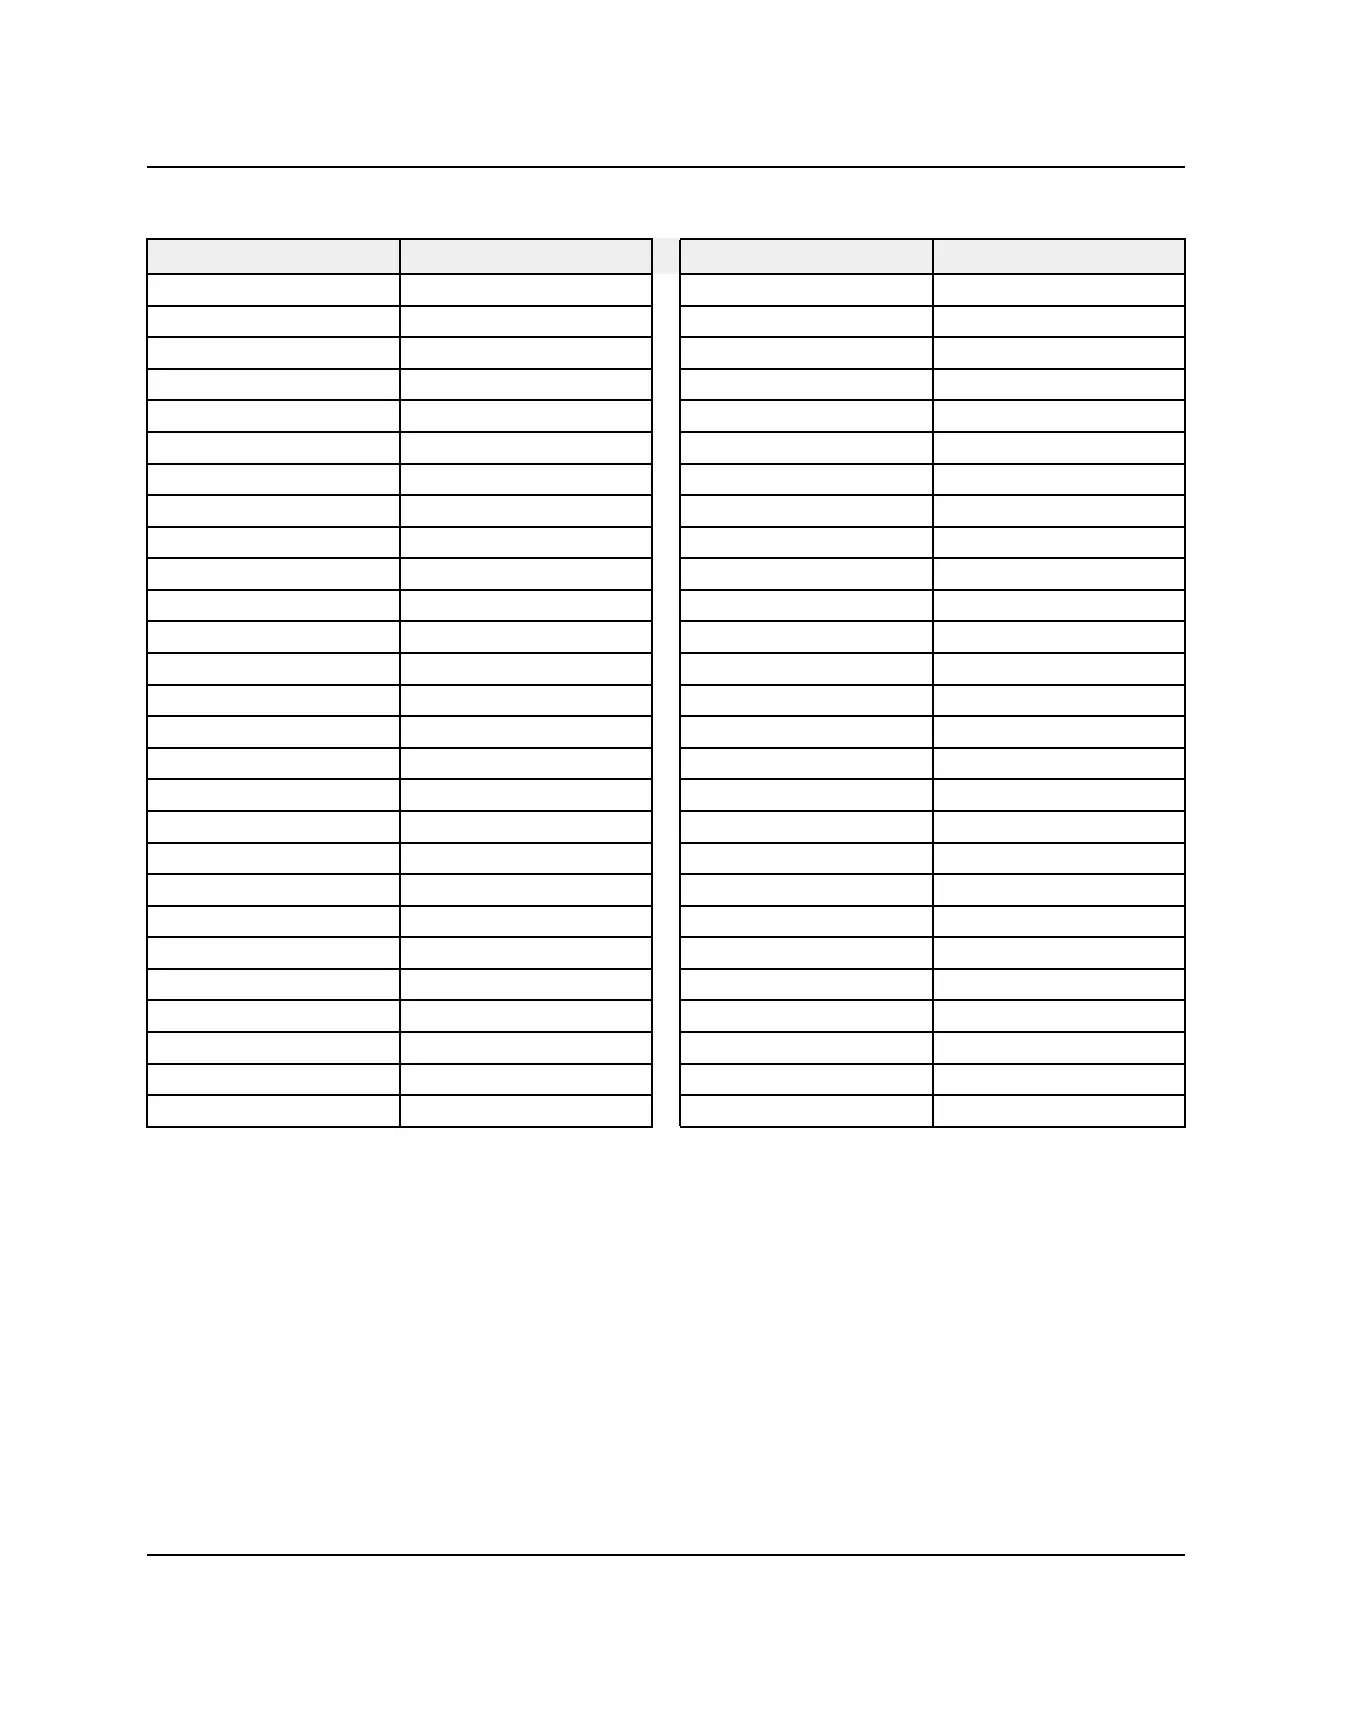
TEMPERATURE / PRESSURE CHART
TEMP °F PSIG TEMP °F PSIG
16 15.69 93 110.20
18 17.04 94 112.10
20 18.43 95 114.10
22 19.87 100 124.30
24 21.35 102 128.50
26 22.88 104 132.90
28 24.47 106 137.30
30 26.10 108 141.90
32 27.79 110 146.50
34 29.52 112 151.30
36 31.32 114 156.10
38 33.17 116 161.10
40 35.07 118 166.10
42 37.03 120 171.30
44 39.05 122 176.60
45 40.09 124 182.00
50 45.48 126 187.50
55 51.27 128 193.10
60 57.47 130 198.90
65 64.10 135 213.70
70 71.19 140 229.40
75 78.75 145 245.80
80 86.80 150 263.00
85 95.40 155 281.10
90 104.40 160 300.10
91 106.30 165 320.10
92 108.20 170 340.80
Evaporator
Pressures represent gas temperatures inside the coil, not the coil surface. For an estimate of the temperature of the air
coming off the coil add 8 - 10°F (-13 to -12°C) to the temperature on the chart.
Condenser
Temperatures are not ambient temperatures but condensing temperatures. Add 4.4° C (40° F) to the ambient
temperature to get the condensing temperature and then refer to the pressure chart to see appropriate pressure for
ambient temperature.
Example: Ambient Temperature = 90ºF
90ºF + 40ºF = 130ºF condenser temperature / 200 PSIG
Conditions and pressures will vary from system to system.
ENGINE / COOLING / EXHAUST
 Loading...