Method No. 3:Data Assimilation
For some special data, the difference of high value and low value is very big. The the blue area is
very large, and it’s difficult to find the effective position. In this situation, we can use the method
of data assimilation to make the graph, then compare it with the Contour Map for reference.
Note: This method need some experience, you can learn after a few times.
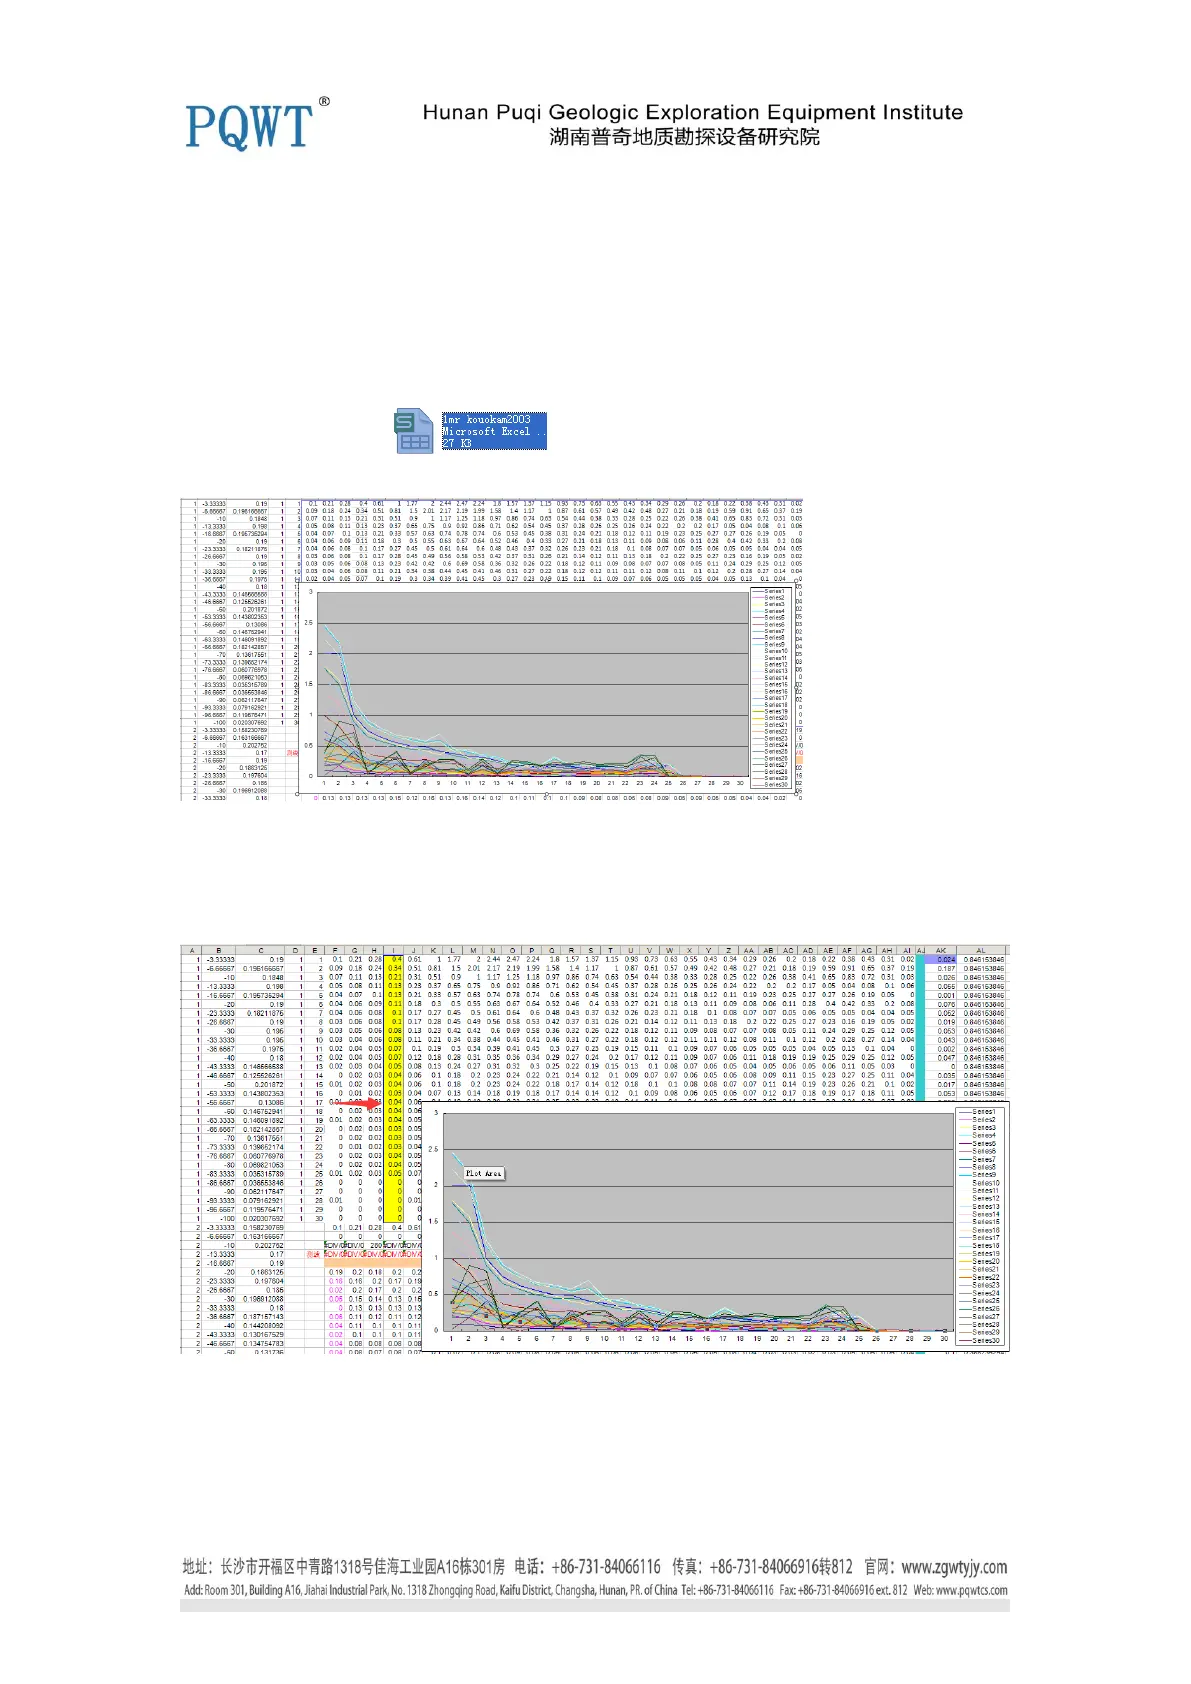
1. Open the Record data , then make the Line Chart as Method No. 1, as show
below in Figure 1,
Figure 1
2. Here you need to select " Reference Line, Reference Point ."
Reference line selection requirement is the most gentle one, as shown below in figure 2:
Figure 2
The chosen reference line of data corresponding to the data in the table above, as shown in figure
2 above.
Reference point selection is a most similar and gentle position in curves, such as the point 20 on
the map.
 Loading...