EasyManuals Logo

PQWT PQWT-S500 User Manual

Default Icon
35 pages
To Next Page IconTo Next Page
To Previous Page IconTo Previous Page
Page #30 background imageLoading...
Page #30 background image
30
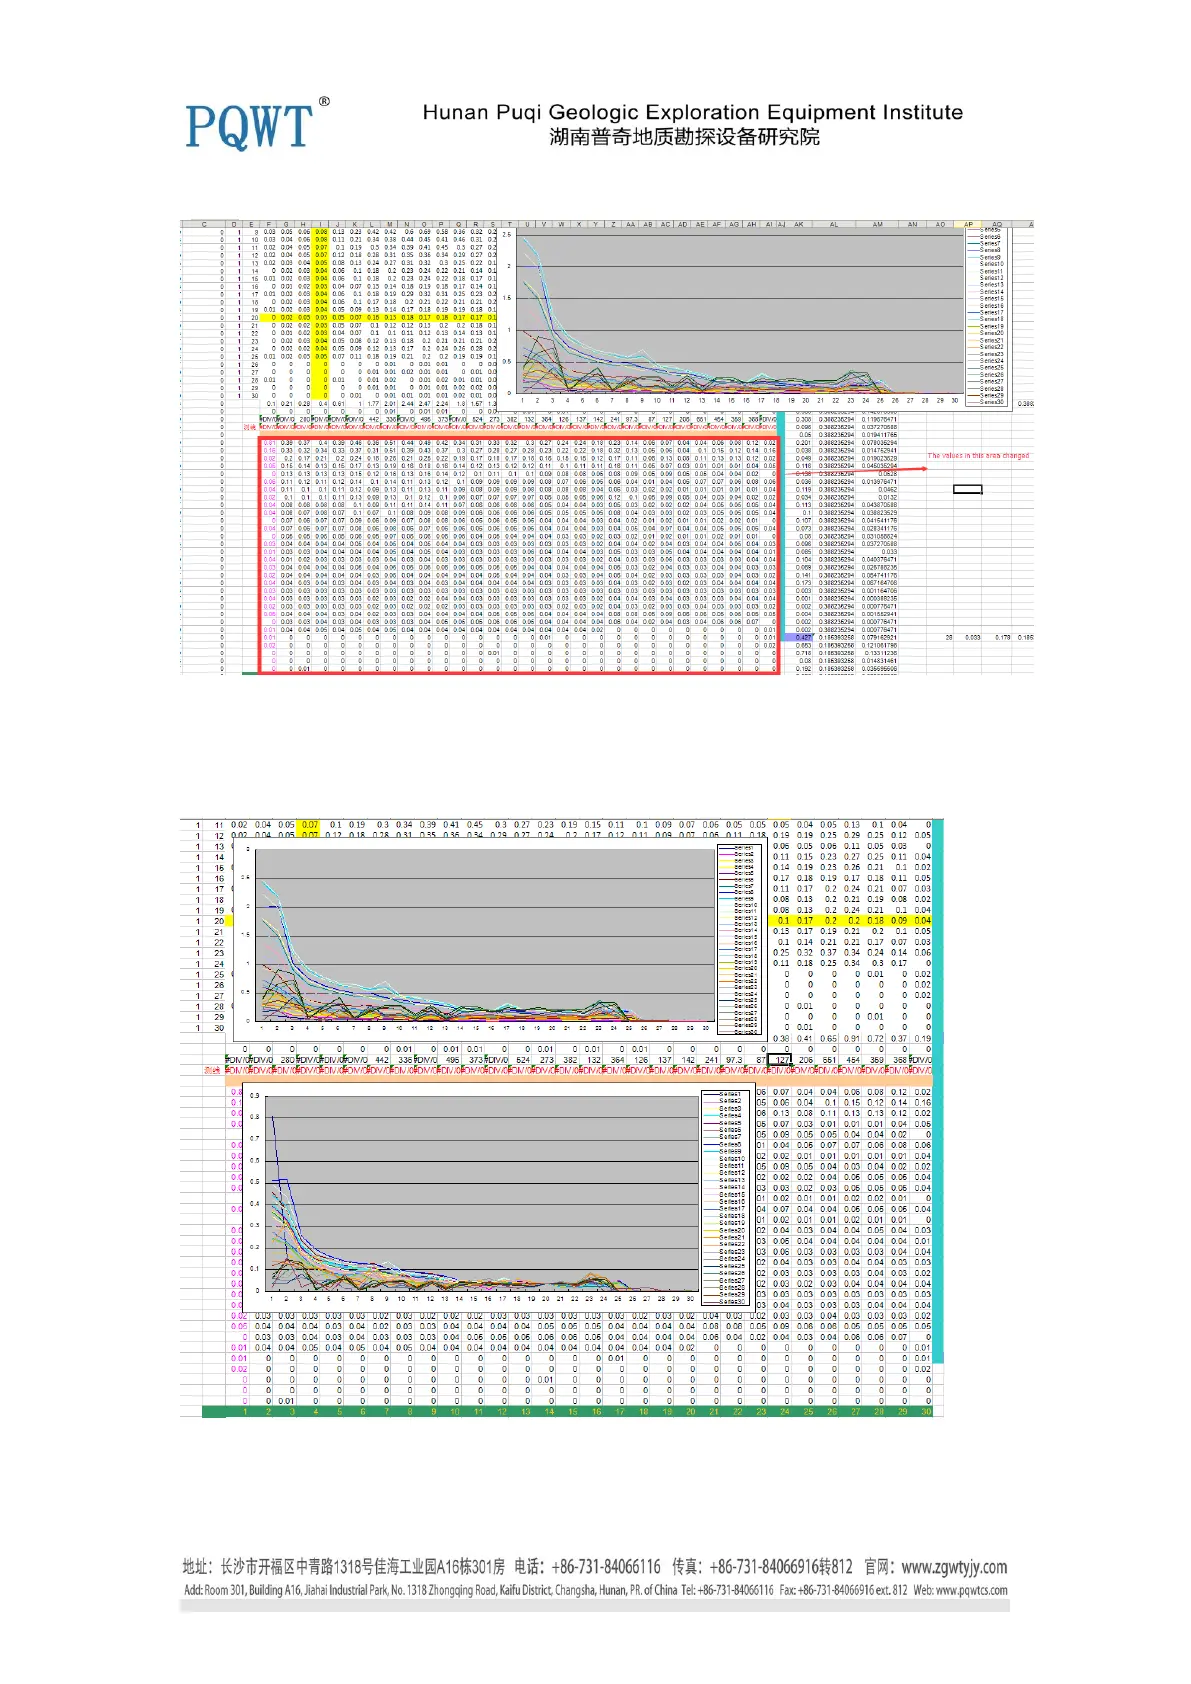
5. After processing the above steps , as shown in Figure 6 below:
Figure 6
6. Make a Line Chart using the data in red frame above, then compare with the original line chart
as shown below in figure 7,
Figure 7
7. Generally the water area we judge based on low values, but the data above, too many high
values, it covers many low values. We can find that the main values in the area below 0.2, so we
Questions and Answers:

Question and Answer IconNeed help?

Do you have a question about the PQWT PQWT-S500 and is the answer not in the manual?

PQWT PQWT-S500 Specifications

General IconGeneral
BrandPQWT
ModelPQWT-S500
CategorySecurity Sensors
LanguageEnglish

Related product manuals