3. June 2024 © Copyright 2024, PROCEQ SA 17
5 Software overview
The GP app software enables visualization of any scan measurement such as line scan & area
scan views with manual zoom. In addition, there is a logbook providing traceability of each
measurement: time, operator, position and instrument information, pictures (with iPad camera)
and written or voice notes.
Given mobile data connectivity (Wifi or mobile network), the GP app automatically and safely
stores all measurements on the Screening Eagle Workspace by synchronizing with the iPad.
Reporting can be done from the Screening Eagle Workspace or the app.
All measurements, settings and image processing tasks are described in tutorial videos
available in GP app or YouTube (Screening Eagle Technologies channel).
Swipe vertically up or down with 2 fingers for navigating between views. Menu is always
accessible on the right.
The slider defining slice thickness & depth is always accessible on the left for time slice
& 3D views with color palette.
5.1 Line scan
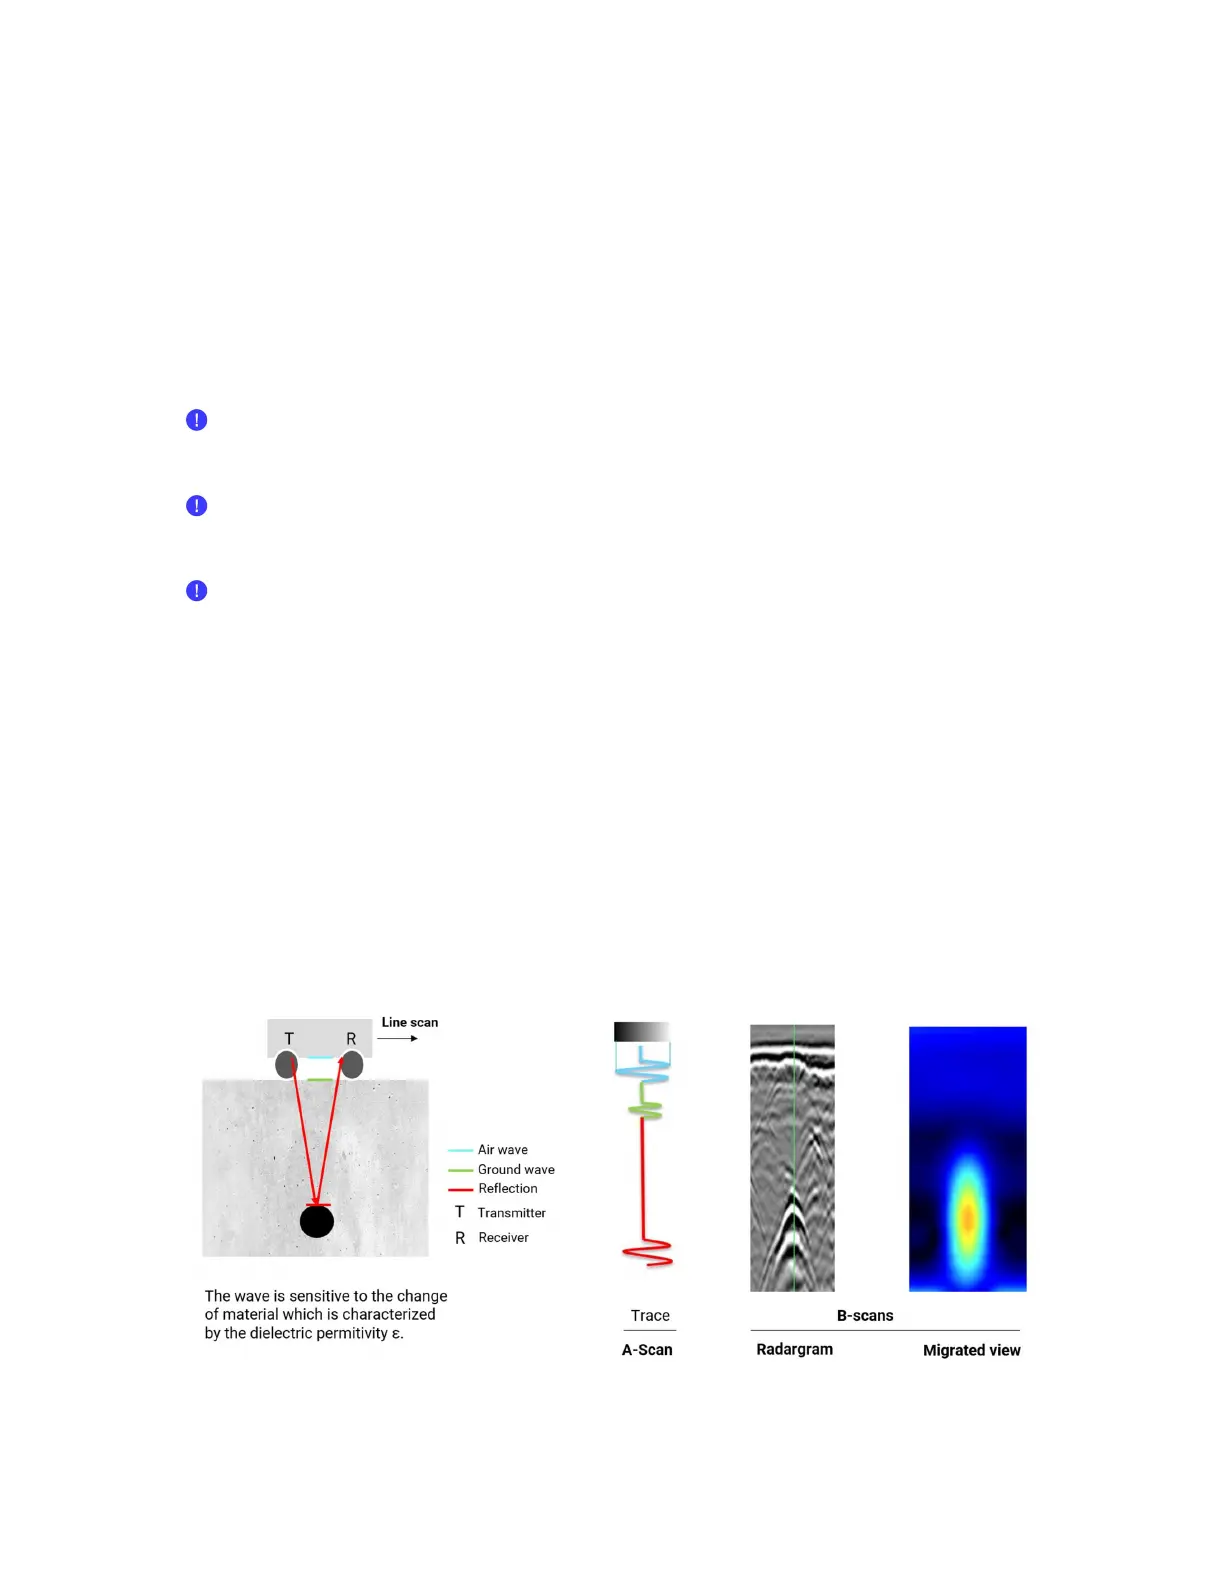
The antenna (transmitter & receiver) above the concrete produces a trace called A-scan based
on the wave trajectory across air, concrete and reflection on objects, every material has
different properties characterized by the dielectric permittivity ε. The reflection is strong on
metallic objects (99% of the wave is reflected). The amplitude of A-scan (generally negative
for metallic objects, positive for non-metallic objects) indicates the change of material and
therefore location of objects at the peak of the amplitude.
When the antenna moves, multiple A-scans are collected along the scan to produce a B-scan
radargram view. The colorful migrated view is a more intuitive way view to identify objects; it
is produced from a processing radargram.
Figure 13 : A-scan, B-scan & migrated views principles
 Loading...