© 2014 Proceq SA 34
• Set the appropriate View, Display Measurements, Display Curve.
• Finish by clicking on export to select the file location, name the file
and in the case of a graphical output to set the output graphic for-
mat: .png, .bmp or .jpg.
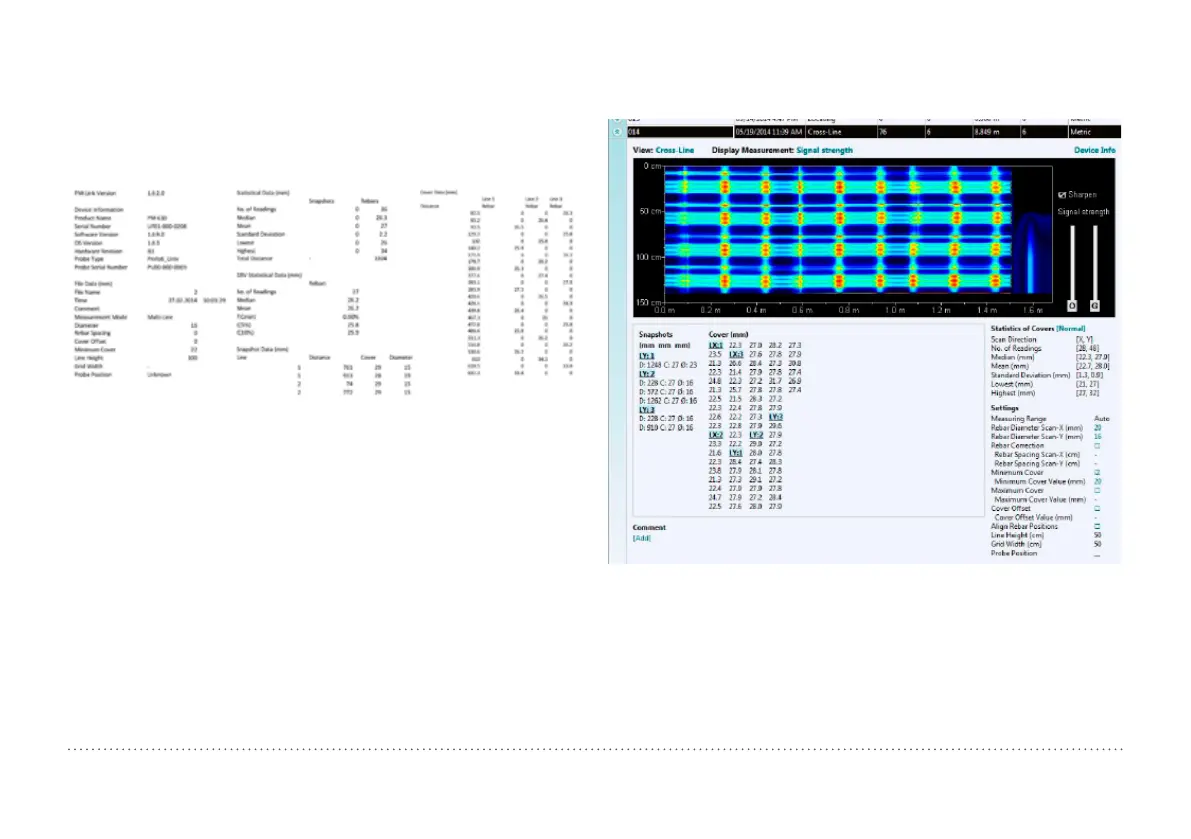
Sample of an exported CVS-file
All Data (starting with PM-Link Version to Statistic Data up to Cover Data)
are written in the first columns starting with column A.
The Cover data of X- and Y-scan measured in the Cross-Line Mode are
shown in different blocks.
The diameters set in the Single-Line Mode are not shown.
Sample of an exported Graphics-file
Cross-Line View Signal Strength Sharpen On