Do you have a question about the ProfiTap IOTA 10G and is the answer not in the manual?
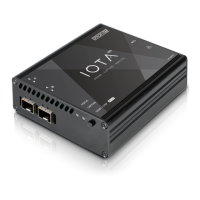
Describes the IOTA as a multifunctional passive network probe with integrated traffic capture and analysis capabilities.
Lists key technical specifications including mode, latency, jitter, performance, storage, power, and management.
Details the physical interfaces, ports, and the meaning of various LED status indicators on the device.
Instructions for connecting network cables to SFP modules for monitoring traffic.
Guidance on how to mount the IOTA 10G device in a standard 19-inch rack using a chassis kit.
Explains power connection methods (DC, PoE) and the device boot process observed via LEDs.
Steps to connect to the IOTA's HTTPS interface, including default IP address and login credentials.
Covers setting the system time, NTP service, and configuring the device's internal clock.
Details how to configure IP address, subnet mask, gateway, DNS, and hostname for network connectivity.
Describes how to manage access control to limit connections from local and remote network clients.
Information on using ZeroTier for secure remote access and managing virtual networks on a cloud application.
Procedures for remotely restarting, shutting down the device, and downloading system and application logs.
Instructions on how to check for and install software updates for the IOTA device.
Options for capturing network traffic and setting up data indexing, including file retention policies.
Overview of device interfaces and settings, including tabs for Port Control, SFP, Firmware, and Filters.
Configuration for operating modes (In-Line, SPAN), loopback, and selecting firmware speed (1Gbps/10Gbps).
Displays status and properties of SFP ports, including temperature, bias, power, and vendor details.
Settings to enable/disable CRC error transmission, packet slicing, and specific port captures.
Procedure for selecting and flashing new firmware versions onto the IOTA device.
Utilizing hardware filters to include or exclude specific packet types during the capture process.
How to initiate traffic capture automatically using the device's START/STOP button without network access.
Managing stored captured data, including downloading PCAP-NG files and deleting unwanted traces.
Steps to upload PCAP-NG or PCAP files to the IOTA for analysis and visualization.
Monitoring the device's disk space usage and configuring automatic cleanup schedules for data retention.
Setting up rules for automatically deleting capture files and index data older than a specified period.
Options for manually cleaning up capture files and index data based on time or index criteria.
An introduction to the main dashboard interface, highlighting key areas like data tables and graphs.
Guidance on using the main menu to select different dashboards and navigate through the interface.
How to set specific time windows or use quick ranges to view data within desired periods.
Methods for applying filters to display specific traffic types or IP addresses on dashboards.
Techniques for zooming into graph segments and adding descriptive annotations to captured data.
Instructions on how to download captured network traffic data in PCAPNG format with applied filters.
Manufacturer's statement regarding warranties, representations, and rights to revise the publication.
Information on intellectual property rights protecting the manual's content, including text and illustrations.
Statement confirming that trademarks mentioned are the sole property of their respective owners.
| Brand | ProfiTap |
|---|---|
| Model | IOTA 10G |
| Category | Measuring Instruments |
| Language | English |