16 A65 GPS Chartplotter
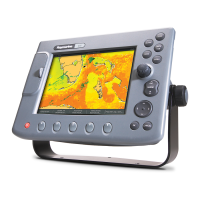
Temp Graph
The Temp Graph Page displays a graph plotting water temperature readings from
the transducer over the past 60 minutes as well as current water temperature,
boat (paddlewheel) speed, battery voltage and a trip log:
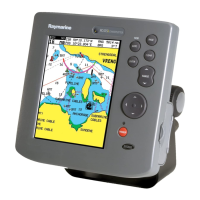
Course Deviation Indicator (CDI)
The Course Deviation Indicator (CDI) gives a graphical representation of your
boat’s course in a ‘rolling road’ format.
As you travel towards the target waypoint, the checkered pattern and the
waypoint will move down the screen at a rate proportional to your boat’s speed.
The steering instructions below the rolling road tell you what correction is needed
to maintain your course and arrive at the target waypoint.
Indication arrows are placed either side of the steering instruction, pointing
towards the center line. The greater the error the more arrows that appear. Correct
your course by steering in the direction indicated by the arrows. If your boat is off
track to the degree that it would not be displayed within the rolling road, the boat
icon flashes.
D8699-2
PRESENTATION
PRESENTATION
TRACKS
TRACKS
ROUTES
ROUTES
GOTO
GOTO
FIND SHIP
FIND SHIP
- +
Speed
kts
60 50 40 30 20 10 0
68
69
70
71
72
73
74
68
69
70
71
72
73
74
Minutes
4.6
Log
Trip
V
13.5
nm
nm
F
28 6
ft
Temperature 71.5°
71.5°F
N 25°30.000
W 078°30.961
28.6ft
9:35:08am
150nm N-UP (RM)
Csr Pos N 26°16.618 W 078°44.961

 Loading...