9Freephone Care Line 0808 100 7666 (ROI 1 800 992 868) or visit shop.coaguchek.com
A Step by Step Guide
Interpreting and Analysing your results
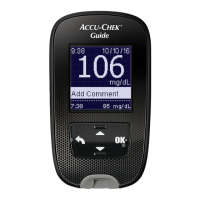
To add a comment, highlight
Add Comment and go to
the comment list.
Green bar if within target
range. (Arrow shows
whether results are higher
or lower than before.)
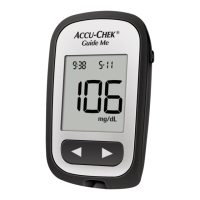
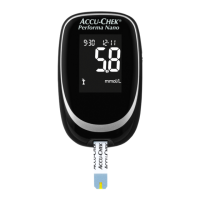
Result Display
If your results are displayed in INR:
Use
and to
highlight, confirm and
proceed with settings.
Blue bar if above target
range (with words
underneath).
If the list of previously
selected comments is
correct, press
.
Yellow bar if below
target range (with
corresponding text).
The result screen now
shows the Comment
symbol . Test is complete.
Remove
test strip, turn the
meter off and dispose of
the test strip.
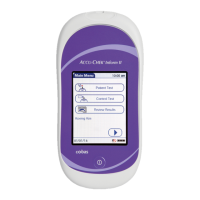
From the Main Menu,
use
to open the My
Results menu, select
Trend and press
to
display the report.
The report above is
shown as Graph view.
Displaying a Trend report Displaying a Target report
In Table view
test results
are shown in a list. The
oldest date is shown at
the bottom and the most
recent date at the top.
Use
to select the
time period you want.
Test results above or
below the measuring
range are marked
accordingly. These test
results appear in red in the
table and are not displayed
in the trend graph.
From the Main Menu,
use
to open the My
Results menu, select
Target and press
to
display the report.
Use
to select the
time period you want to
evaluate. Press
to toggle
between graph and table
display. Press the Back
button to return to the My
Results menu.
29 Jun 2015

 Loading...