Waveform analysis
R&S
®
RTP
275User Manual 1337.9952.02 ─ 12
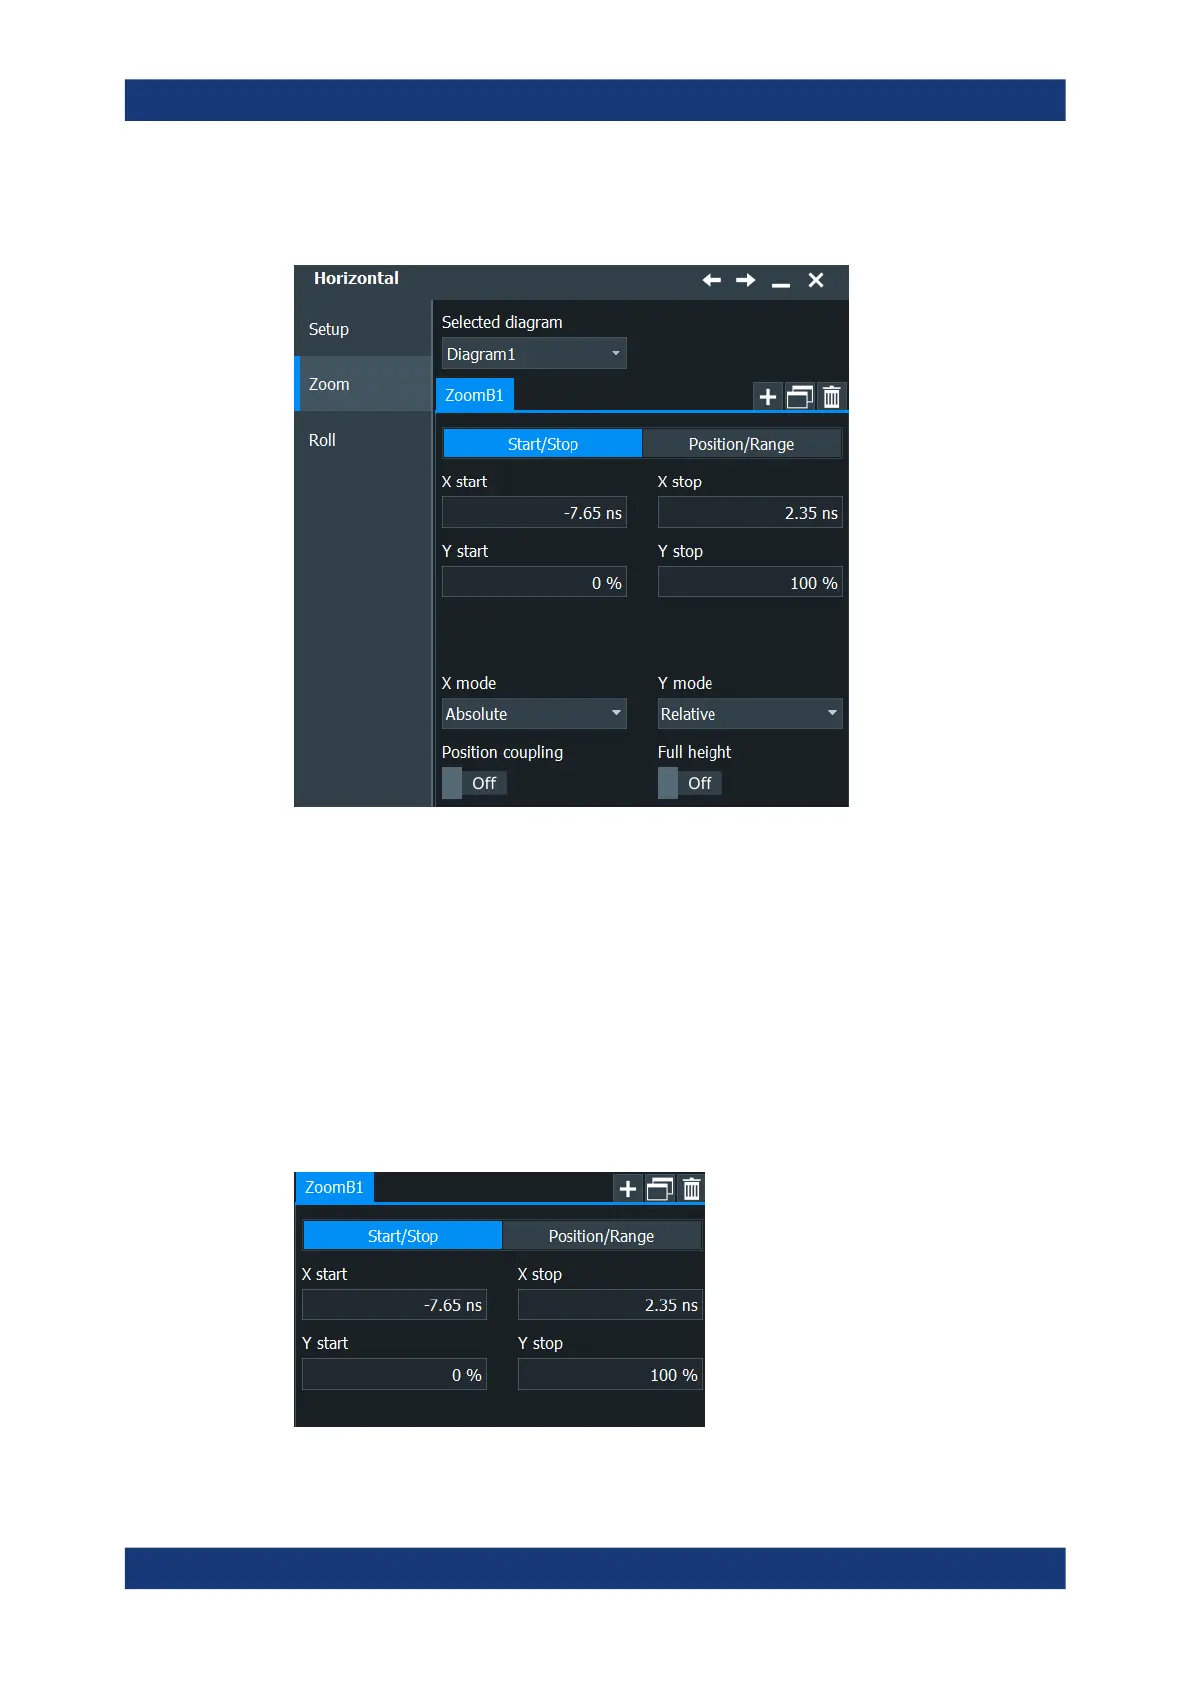
The "Zoom" tab allows you to specify start and stop values for the x- and y-axes. The
acquired data within these ranges is zoomed.
Additionally, you can enable a "Zoom Overlay" in the "Menu" > "Settings" > "Appear-
ance" > "Diagram", see Chapter 4.3.4, "Diagram appearance settings", on page 101.
Selected diagram
Indicates which of the waveform diagrams is selected for zooming.
Mode
Selects how the window for the zoom diagram is defined. You can select between
defining "Start/Stop" values or "Position/Range".
Start/Stop
The "Start/Stop" tab allows you to specify start and stop values for the x- and y-axes.
The acquired data within these ranges is zoomed.
Zoom

 Loading...


