Waveform analysis
R&S
®
RTP
318User Manual 1337.9952.02 ─ 12
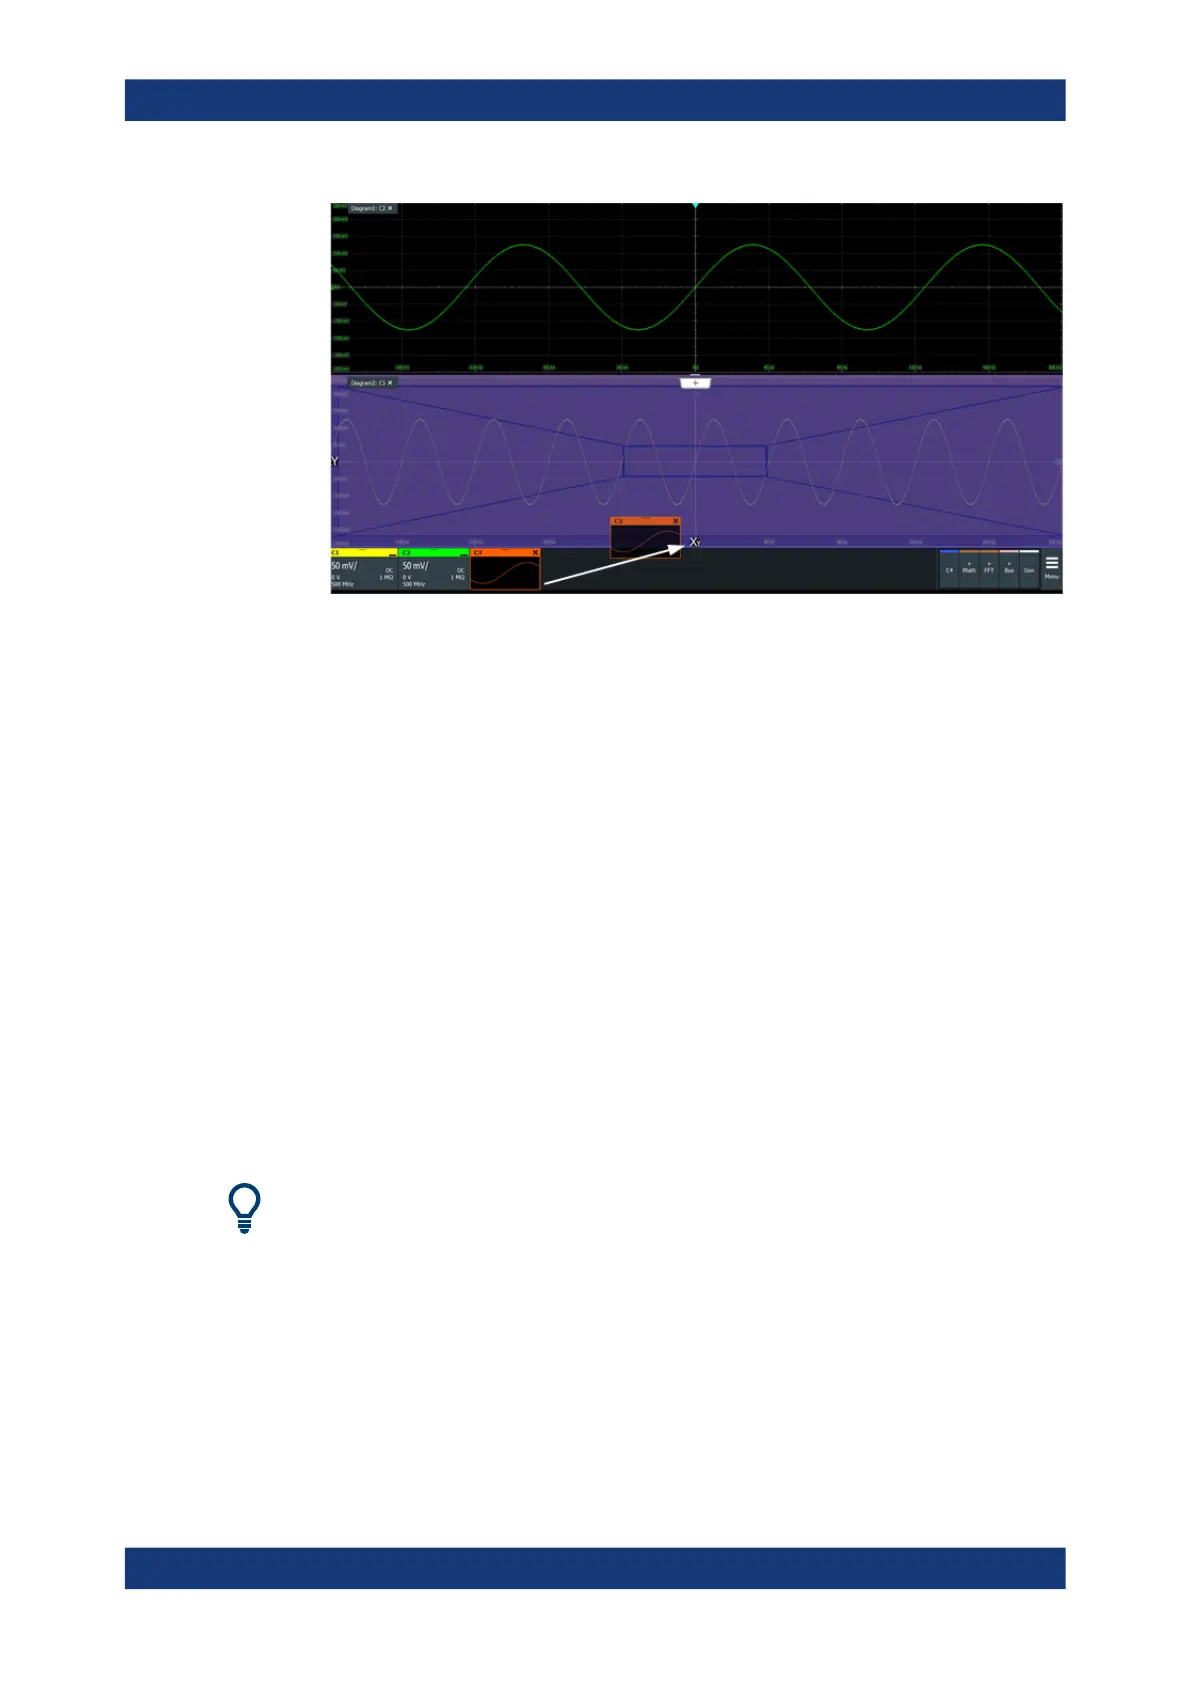
The diagram is converted into an XY-diagram.
To set up an XY-diagram
1. Press the [App Cockpit] key.
2. In the >"Analysis" tab, tap the "XY-Diagram".
3. Enable the "XY-diagram".
4. In the "X-source" field, define the signal source that supplies the x-values of the
XY-diagram. Select one of the following:
● One of the waveforms of any channel
● A reference waveform
● The results of a mathematical function
5. In the "Y-source" field, define the signal source that supplies the y values of the XY-
diagram.
6. To switch the x- and y-values quickly, tap the "Swap XY" button.
7. To maintain a constant ratio while the x- and y-axes are adapted to the acquired
data dynamically, activate the "Constant XY-ratio" option.
If the XY-diagram is active or minimized, touch and hold the signal icon to open the
"XY-diagram" tab.
XY-diagram

 Loading...


