DT 300
(v0.1)
IS DT300 1410 (SE_GB_D_ES).doc 7
Monitoring units and detectors, has built in “fail safe“ circuit
that enables un failure indication in case of sensor error. The
same alarm occurs in case of the sensor signal reaches below
0,1VDC due to an incorrect adjusted GV-offset e.g.
7. Control and altering of alarm thresholds
At the vertical PC-board of the monitoring- / detector unit, there
are three (3) potentiometers for adjustment of alarm thresholds
for C-, B- and A-alarm
Altering alarm thresholds:
After connecting the instrument, the three actual thresholds of
C-, B- & A-alarms are visualized on the bottom row of digits.
Adjust at the corresponding potentiometer, to reach desired
value.
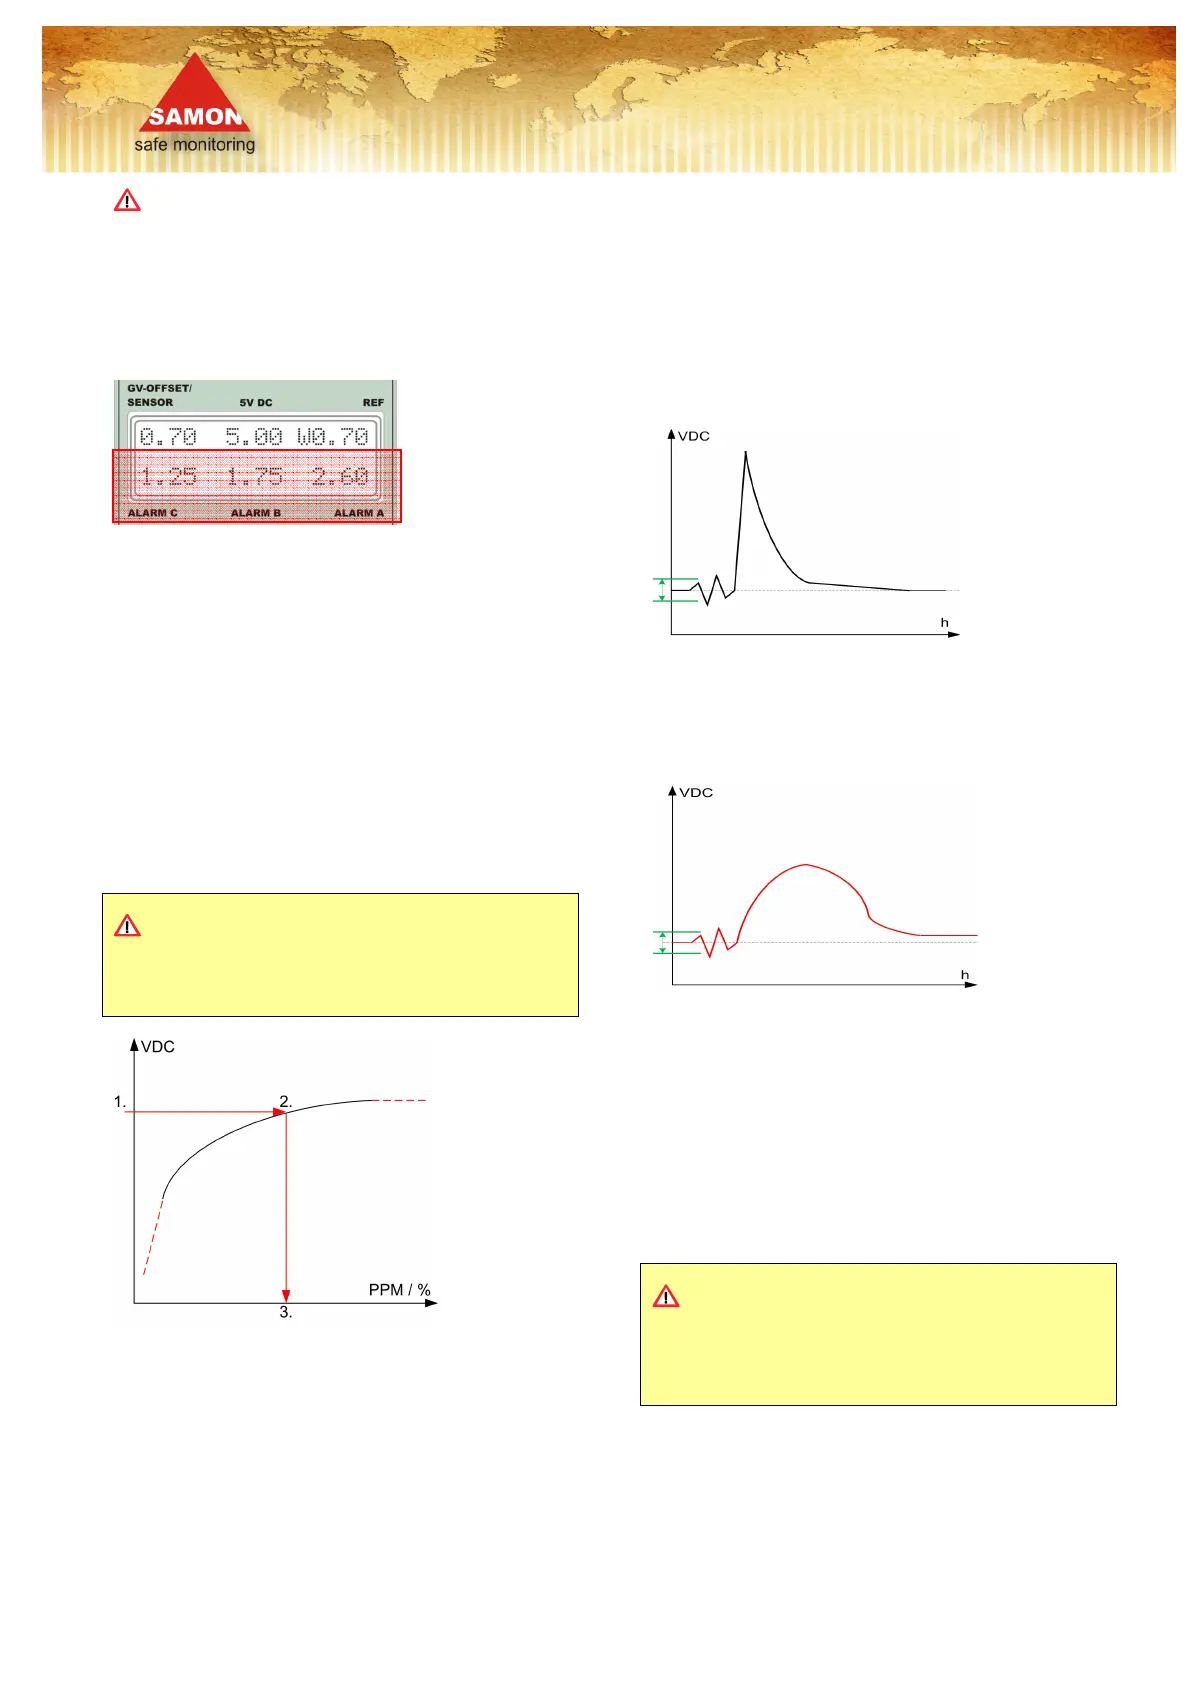
In the data-sheet of the actual sensor head, the desired alarm
levels can be read as PPM / % and as a corresponding voltage
value VDC. In order to check the corresponding PPM/%-value
for a threshold value in VDC, one starts by finding the VDC-
value at the vertical axel. Then following an imagined horizontal
line until it reaches the graph, and there after follow an
imagined vertical line until it reaches the horizontal axel of the
diagram.
On the horizontal axel the corresponding PPM/% value can be
read. If one likes to find the corresponding VDC-value for a
certain PPM/%-value, the procedure is to be carried out in the
opposite order. (See picture below)
Alarm thresholds should be chosen within the area of the
solid line of the graph. If values are chosen from the area of the
dotted line, there are significant risks of distortion with false
alarms or total absence of alarm as a consequence.
Example, sensor graph
8. Check of the response- and recovery time of the sensor
by performing a ”bump test”
After check and eventual adjustments of the sensor off-set, a
function control is to be carried out. By exposing the sensor to
a small amount of concentrated gas directly to the sensor head,
the response- and recovery time can be checked. The sensor
head shall be exposed, and eventual splash protection removed
during the test.
The comprehension is that the sensor signal is within the
"normal" area when exposed to clean air (the green area of the
sensor graph)
- Expose the sensor to the actual gas for 5 sec maximum, the
sensor should react instantly and reach > 4VDC within 2-5 sec.
- The signal output should reach the start level within ~ 5
minutes after finished gas exposure. (see graphs below)
(Most SC-sensors can be checked with Butan gas, as used in
ordinary cigarette lighters.) The sensor for Hydrogen H2 is an
exception
The graph below shows the quick response- and
recovery time for a healthy sensor
If the response- and recovery time is slow, or if the output signal
does not reach the start value according to the suggested time
frame, the sensor is probably contaminated and shall be
replaced.
The graph below shows a slow response- and recovery
time of a contaminated sensor.
9. Battery indication ”low Batt”
The LED ”Low Batt” will light up with a constant light when the
batteries are close to empty. When the LED starts to flash, the
batteries are to be replaced.
10. Trouble shooting
If the actual detector does not generate an alarm when
exposed to gas. Check the following:
- GV-offset and sensor signal due to point 6 and 8
- Alarm threshold settings
- DIP-switches, settings of alarm delay
- That detector is not in service mode
Storage of the instrument
It is of significant importance to the reliability of the instrument,
that the storage conditions are such, that it is not exposed to
substances that can contaminate or damaged the sensor head
of the instrument.
Technical specifications subject to alteration
 Loading...