EB 8389 EN 53
Statistical information
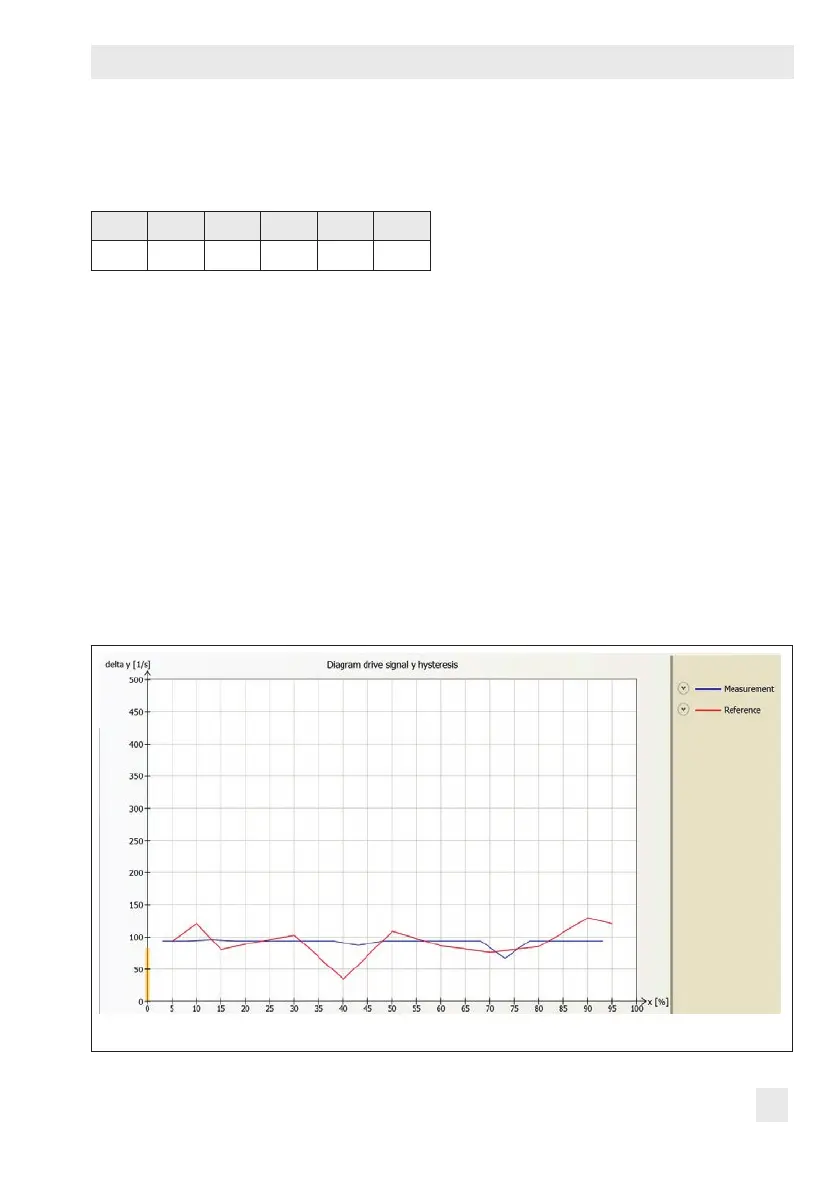
4.7 Drive signal diagram hys-
teresis
3730-2 3730-3 3731-3 3730-4 3730-5 3731-5
• • • • • •
The 'Drive signal diagram hysteresis' records
the change in drive signal ∆y in relation to
the valve position x.
The drive signal y is based on the internal
control signal of the i/p converter. This sig-
nal runs directly proportional to the signal
pressure p
out
in the pneumatic actuator, in re-
lation to the valve position.
The statistical information 'Drive signal dia-
gram - Hysteresis' allows an analysis in the
change of the friction forces in Types3730-
2/-3 and Types3731-3/-5.
Data are recorded after the hysteresis test is
activated. A single test can be performed im-
mediately or regular tests can be performed
after the adjusted time interval has elapsed.
The following listed parameters are activated
while the hysteresis test is being performed:
− Travel/angle range start (Code 8): 0%
− Travel/angle range end (Code 9): 100%
− Enable travel/angle lower limit
(Code10): Off
− Enable travel/angle upper limit
(Code11): Off
− Enable set point cutoff decrease
(Code14): Off
− Enable set point cutoff increase
(Code15): Off
Fig.7: Diagnosis > Statistical information > Drive signal diagram > Hysteresis
 Loading...