-28-
Daily Reports
Daily reports show daily detailed information.
Daily Overall
Daily overall shows the average of sensor glucose readings, the percentage of time in
which the sensor glucose readings were within and out of the target glucose range.
Daily Trending
Daily trending is a graph of sensor glucose readings by day. The symbols identifying
notes are shown in the graph.
Select Date
⚫ Tap Previous and Next on the top of the screen to see data of the previous and the
next day respectively, or
⚫ Tap the icon on the top middle to select the date you want to review.
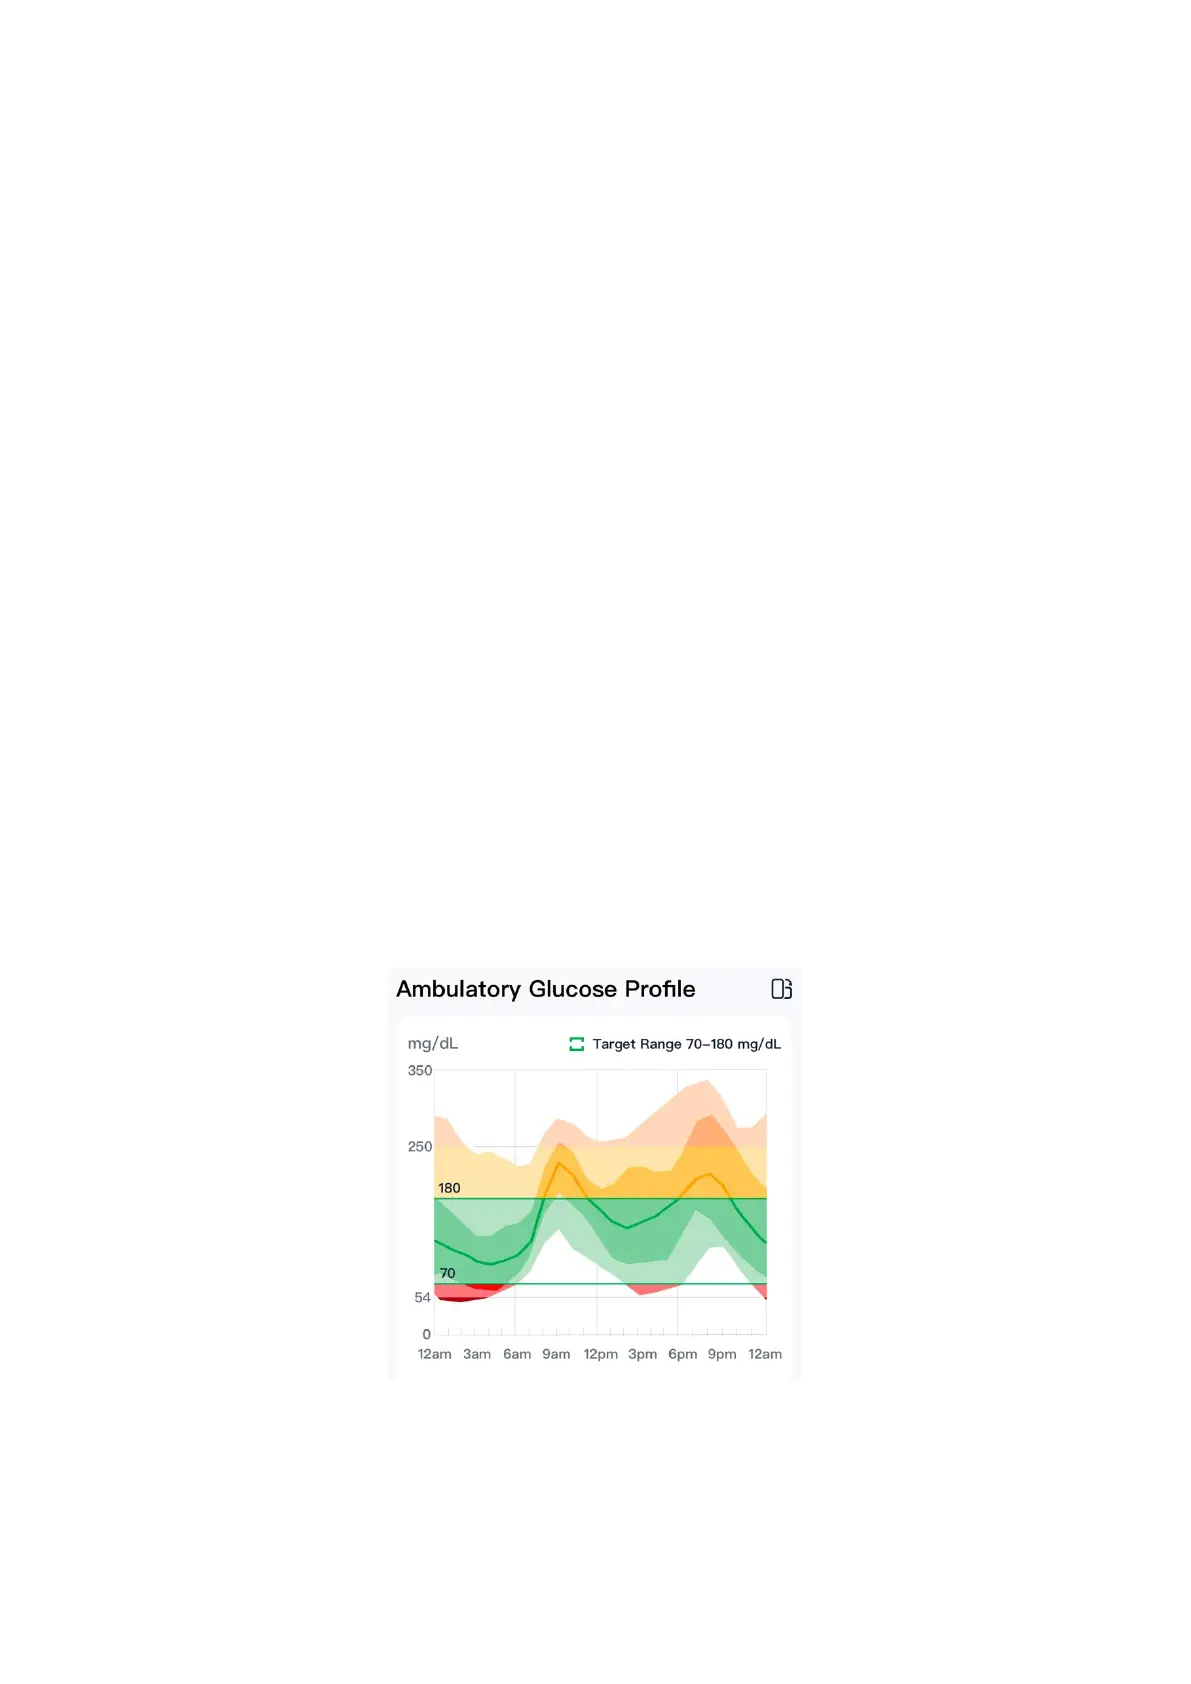
AGP Reports
AGP reports show summaries of information over several days.
AGP shows the pattern and variability of the sensor glucose levels over a typical day.
⚫ Viewing AGP Reports
The green part shows the target range of glucose readings.
NOTE: AGP needs at least 5 days of glucose data.
⚫ Trending Comparison
Select days to compare the glucose trending.
 Loading...