Configuring with Web Based Management
6.6 "Interfaces" menu
SCALANCE W780/W740 to IEEE 802.11n Web Based Management
320 Configuration Manual, 08/2018, C79000-G8976-C267-13
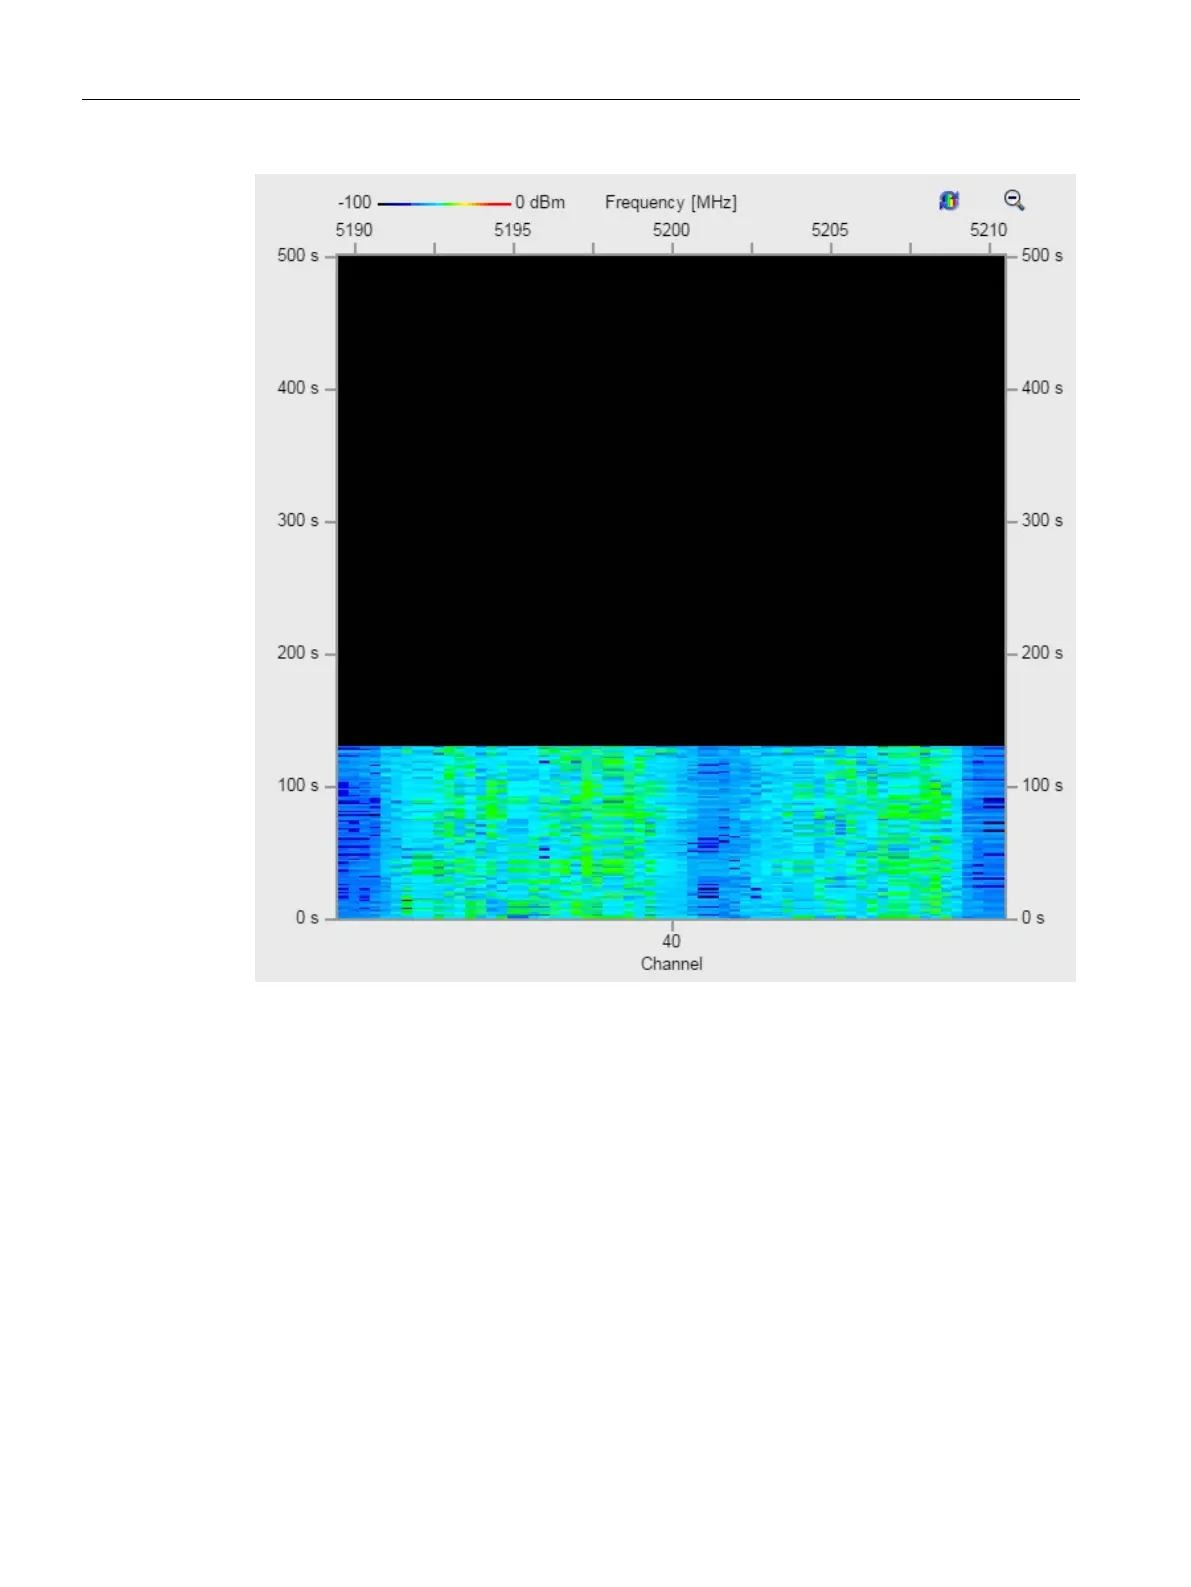
The y axis shows the course of the measured values over time from current (0 s) to the
values received before 500 s.
The graphic shows the strength of all signals that the access point receives in its
environment in the configured frequency range.
The color depends on the setting for "Color Scheme".
● Density Chart
 Loading...