9 Operation at Use of the Display
9.3 Display Content
282 SICAM Q100, 7KG95xx, Device Manual
E50417-H1040-C522-A4, Edition 03.2018
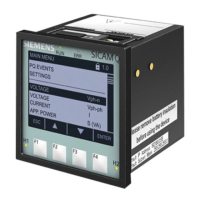
Display of Bar Charts
Bar charts are displayed as follows:
Figure 9-4 Bar Chart Display
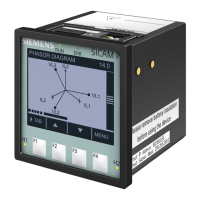
Display of Phasor Diagrams
Phasor diagrams are displayed as follows:
Figure 9-5 Display of Phasor Diagrams
Max Menu
Harm. voltage 15.0
III I
2 3 4 5 6 7 8 9
[%]
0.2
0.1
Menü
Phasor diagram 14.0
III I
V a
V b
V c
Tab.
 Loading...